charts
Domain A11y Explore Bar Chart a11y Example
Example:
/// Example of a bar chart with domain selection A11y behavior.
///
/// The OS screen reader (TalkBack / VoiceOver) setting must be turned on, or
/// the behavior does not do anything.
///
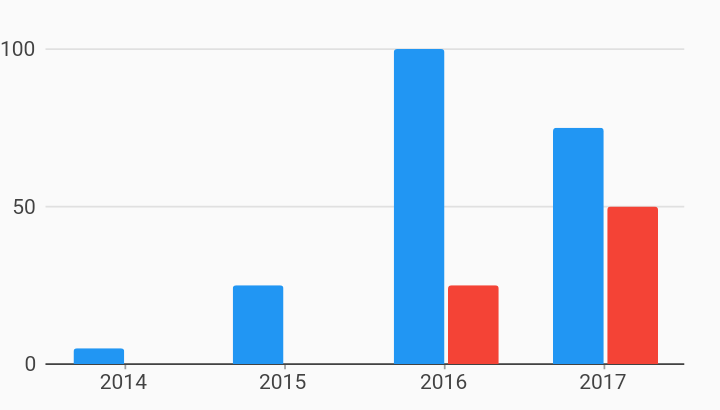
/// Note that the screenshot does not show any visual differences but when the
/// OS screen reader is enabled, the node that is being read out loud will be
/// surrounded by a rectangle.
///
/// When [DomainA11yExploreBehavior] is added to the chart, the chart will
/// listen for the gesture that triggers "explore mode".
/// "Explore mode" creates semantic nodes for each domain value in the chart
/// with a description (customizable, defaults to domain value) and a bounding
/// box that surrounds the domain.
///
/// These semantic node descriptions are read out loud by the OS screen reader
/// when the user taps within the bounding box, or when the user cycles through
/// the screen's elements (such as swiping left and right).
import 'package:charts_flutter/flutter.dart' as charts;
import 'package:flutter/material.dart';
class DomainA11yExploreBarChart extends StatelessWidget {
final List<charts.Series> seriesList;
final bool animate;
DomainA11yExploreBarChart(this.seriesList, {this.animate});
/// Creates a [BarChart] with sample data and no transition.
factory DomainA11yExploreBarChart.withSampleData() {
return new DomainA11yExploreBarChart(
_createSampleData(),
// Disable animations for image tests.
animate: false,
);
}
/// An example of how to generate a customized vocalization for
/// [DomainA11yExploreBehavior] from a list of [SeriesDatum]s.
///
/// The list of series datums is for one domain.
///
/// This example vocalizes the domain, then for each series that has that
/// domain, it vocalizes the series display name and the measure and a
/// description of that measure.
String vocalizeDomainAndMeasures(List<charts.SeriesDatum> seriesDatums) {
final buffer = new StringBuffer();
// The datum's type in this case is [OrdinalSales].
// So we can access year and sales information here.
buffer.write(seriesDatums.first.datum.year);
for (charts.SeriesDatum seriesDatum in seriesDatums) {
final series = seriesDatum.series;
final datum = seriesDatum.datum;
buffer.write(' ${series.displayName} '
'${datum.sales / 1000} thousand dollars');
}
return buffer.toString();
}
@override
Widget build(BuildContext context) {
return new Semantics(
// Describe your chart
label: 'Yearly sales bar chart',
// Optionally provide a hint for the user to know how to trigger
// explore mode.
hint: 'Press and hold to enable explore',
child: new charts.BarChart(
seriesList,
animate: animate,
// To prevent conflict with the select nearest behavior that uses the
// tap gesture, turn off default interactions when the user is using
// an accessibility service like TalkBack or VoiceOver to interact
// with the application.
defaultInteractions: !MediaQuery.of(context).accessibleNavigation,
behaviors: [
new charts.DomainA11yExploreBehavior(
// Callback for generating the message that is vocalized.
// An example of how to use is in [vocalizeDomainAndMeasures].
// If none is set, the default only vocalizes the domain value.
vocalizationCallback: vocalizeDomainAndMeasures,
// The following settings are optional, but shown here for
// demonstration purchases.
// [exploreModeTrigger] Default is press and hold, can be
// changed to tap.
exploreModeTrigger: charts.ExploreModeTrigger.pressHold,
// [exploreModeEnabledAnnouncement] Optionally notify the OS
// when explore mode is enabled.
exploreModeEnabledAnnouncement: 'Explore mode enabled',
// [exploreModeDisabledAnnouncement] Optionally notify the OS
// when explore mode is disabled.
exploreModeDisabledAnnouncement: 'Explore mode disabled',
// [minimumWidth] Default and minimum is 1.0. This is the
// minimum width of the screen reader bounding box. The bounding
// box width is calculated based on the domain axis step size.
// Minimum width will be used if the step size is smaller.
minimumWidth: 1.0,
),
// Optionally include domain highlighter as a behavior.
// This behavior is included in this example to show that when an
// a11y node has focus, the chart's internal selection model is
// also updated.
new charts.DomainHighlighter(charts.SelectionModelType.info),
],
));
}
/// Create one series with sample hard coded data.
static List<charts.Series<OrdinalSales, String>> _createSampleData() {
final mobileData = [
new OrdinalSales('2014', 5),
new OrdinalSales('2015', 25),
new OrdinalSales('2016', 100),
new OrdinalSales('2017', 75),
];
final tabletData = [
// Purposely missing data to show that only measures that are available
// are vocalized.
new OrdinalSales('2016', 25),
new OrdinalSales('2017', 50),
];
return [
new charts.Series<OrdinalSales, String>(
id: 'Mobile Sales',
colorFn: (_, __) => charts.MaterialPalette.blue.shadeDefault,
domainFn: (OrdinalSales sales, _) => sales.year,
measureFn: (OrdinalSales sales, _) => sales.sales,
data: mobileData,
),
new charts.Series<OrdinalSales, String>(
id: 'Tablet Sales',
colorFn: (_, __) => charts.MaterialPalette.red.shadeDefault,
domainFn: (OrdinalSales sales, _) => sales.year,
measureFn: (OrdinalSales sales, _) => sales.sales,
data: tabletData,
)
];
}
}
/// Sample ordinal data type.
class OrdinalSales {
final String year;
final int sales;
OrdinalSales(this.year, this.sales);
}