charts
Horizontal Bar Label Bar Chart Example
Example:
/// Horizontal bar chart with bar label renderer example and hidden domain axis.
import 'package:charts_flutter/flutter.dart' as charts;
import 'package:flutter/material.dart';
class HorizontalBarLabelChart extends StatelessWidget {
final List<charts.Series> seriesList;
final bool animate;
HorizontalBarLabelChart(this.seriesList, {this.animate});
/// Creates a [BarChart] with sample data and no transition.
factory HorizontalBarLabelChart.withSampleData() {
return new HorizontalBarLabelChart(
_createSampleData(),
// Disable animations for image tests.
animate: false,
);
}
// [BarLabelDecorator] will automatically position the label
// inside the bar if the label will fit. If the label will not fit and the
// area outside of the bar is larger than the bar, it will draw outside of the
// bar. Labels can always display inside or outside using [LabelPosition].
//
// Text style for inside / outside can be controlled independently by setting
// [insideLabelStyleSpec] and [outsideLabelStyleSpec].
@override
Widget build(BuildContext context) {
return new charts.BarChart(
seriesList,
animate: animate,
vertical: false,
// Set a bar label decorator.
// Example configuring different styles for inside/outside:
// barRendererDecorator: new charts.BarLabelDecorator(
// insideLabelStyleSpec: new charts.TextStyleSpec(...),
// outsideLabelStyleSpec: new charts.TextStyleSpec(...)),
barRendererDecorator: new charts.BarLabelDecorator<String>(),
// Hide domain axis.
domainAxis:
new charts.OrdinalAxisSpec(renderSpec: new charts.NoneRenderSpec()),
);
}
/// Create one series with sample hard coded data.
static List<charts.Series<OrdinalSales, String>> _createSampleData() {
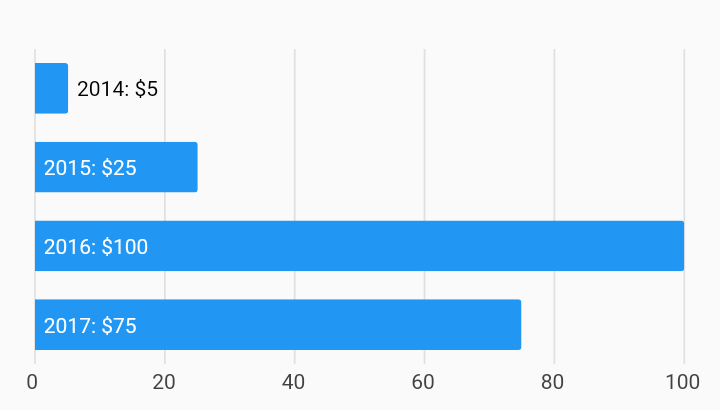
final data = [
new OrdinalSales('2014', 5),
new OrdinalSales('2015', 25),
new OrdinalSales('2016', 100),
new OrdinalSales('2017', 75),
];
return [
new charts.Series<OrdinalSales, String>(
id: 'Sales',
domainFn: (OrdinalSales sales, _) => sales.year,
measureFn: (OrdinalSales sales, _) => sales.sales,
data: data,
// Set a label accessor to control the text of the bar label.
labelAccessorFn: (OrdinalSales sales, _) =>
'${sales.year}: \$${sales.sales.toString()}')
];
}
}
/// Sample ordinal data type.
class OrdinalSales {
final String year;
final int sales;
OrdinalSales(this.year, this.sales);
}