charts
Chart Title Behaviors Example
Example:
import 'dart:math';
// EXCLUDE_FROM_GALLERY_DOCS_END
import 'package:charts_flutter/flutter.dart' as charts;
import 'package:flutter/material.dart';
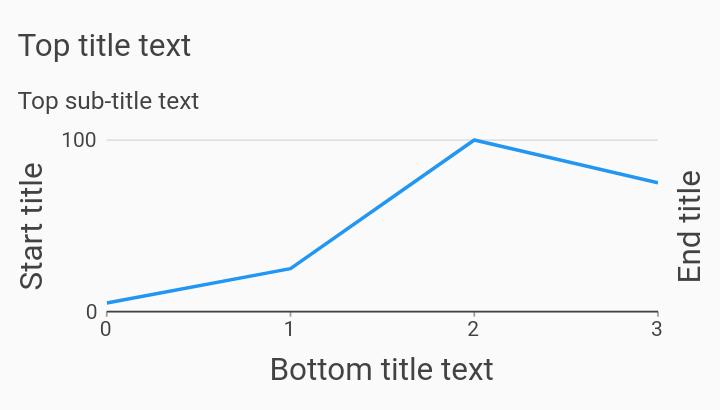
/// This is a line chart with a title text in every margin.
///
/// A series of [ChartTitle] behaviors are used to render titles, one per
/// margin.
class ChartTitleLine extends StatelessWidget {
final List<charts.Series> seriesList;
final bool animate;
ChartTitleLine(this.seriesList, {this.animate});
/// Creates a [LineChart] with sample data and no transition.
factory ChartTitleLine.withSampleData() {
return new ChartTitleLine(
_createSampleData(),
// Disable animations for image tests.
animate: false,
);
}
@override
Widget build(BuildContext context) {
return new charts.LineChart(
seriesList,
animate: animate,
// Configures four [ChartTitle] behaviors to render titles in each chart
// margin. The top title has a sub-title, and is aligned to the left edge
// of the chart. The other titles are aligned with the middle of the draw
// area.
behaviors: [
new charts.ChartTitle('Top title text',
subTitle: 'Top sub-title text',
behaviorPosition: charts.BehaviorPosition.top,
titleOutsideJustification: charts.OutsideJustification.start,
// Set a larger inner padding than the default (10) to avoid
// rendering the text too close to the top measure axis tick label.
// The top tick label may extend upwards into the top margin region
// if it is located at the top of the draw area.
innerPadding: 18),
new charts.ChartTitle('Bottom title text',
behaviorPosition: charts.BehaviorPosition.bottom,
titleOutsideJustification:
charts.OutsideJustification.middleDrawArea),
new charts.ChartTitle('Start title',
behaviorPosition: charts.BehaviorPosition.start,
titleOutsideJustification:
charts.OutsideJustification.middleDrawArea),
new charts.ChartTitle('End title',
behaviorPosition: charts.BehaviorPosition.end,
titleOutsideJustification:
charts.OutsideJustification.middleDrawArea),
],
);
}
/// Create one series with sample hard coded data.
static List<charts.Series<LinearSales, int>> _createSampleData() {
final data = [
new LinearSales(0, 5),
new LinearSales(1, 25),
new LinearSales(2, 100),
new LinearSales(3, 75),
];
return [
new charts.Series<LinearSales, int>(
id: 'Sales',
domainFn: (LinearSales sales, _) => sales.year,
measureFn: (LinearSales sales, _) => sales.sales,
data: data,
)
];
}
}
/// Sample linear data type.
class LinearSales {
final int year;
final int sales;
LinearSales(this.year, this.sales);
}