charts
Initial Hint Animation Behaviors Example
Example:
/// Example of initial hint animation behavior.
///
/// To see the animation, please run the example app and select
/// "Initial hint animation".
///
/// This behavior is intended to be used with charts that also have pan/zoom
/// behaviors added and/or the initial viewport set in [AxisSpec].
///
/// Adding this behavior will cause the chart to animate from a scale and/or
/// offset of the desired final viewport. If the user taps the widget prior
/// to the animation being completed, animation will stop.
///
/// [maxHintScaleFactor] is the amount the domain axis will be scaled at the
/// start of te hint. By default, this is null, indicating that there will be
/// no scale factor hint. A value of 1.0 means the viewport is showing all
/// domains in the viewport. If a value is provided, it cannot be less than 1.0.
///
/// [maxHintTranslate] is the amount of ordinal values to translate the viewport
/// from the desired initial viewport. Currently only works for ordinal axis.
///
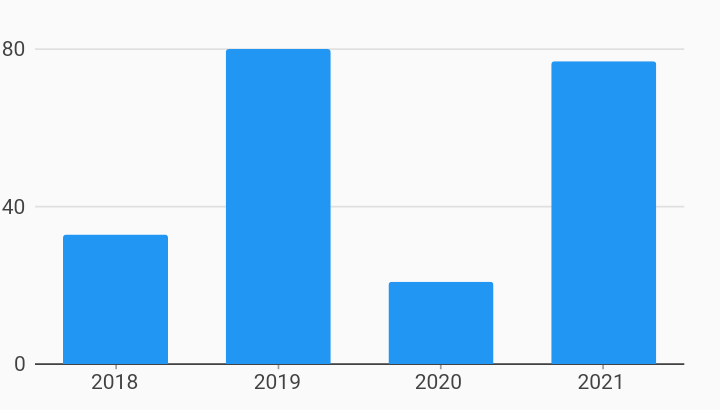
/// In this example, the series list has ordinal data from year 2014 to 2030,
/// and we have the initial viewport set to start at 2018 that shows 4 values by
/// specifying an [OrdinalViewport] in [OrdinalAxisSpec]. We can add the hint
/// animation by adding behavior [InitialHintBehavior] with [maxHintTranslate]
/// of 4. When the chart is drawn for the first time, the viewport will show
/// 2022 as the first value and the viewport will animate by panning values to
/// the right until 2018 is the first value in the viewport.
import 'package:charts_flutter/flutter.dart' as charts;
import 'package:flutter/material.dart';
class InitialHintAnimation extends StatelessWidget {
final List<charts.Series> seriesList;
final bool animate;
InitialHintAnimation(this.seriesList, {this.animate});
/// Creates a [BarChart] with sample data and no transition.
factory InitialHintAnimation.withSampleData() {
return new InitialHintAnimation(
_createSampleData(),
// Disable animations for image tests.
animate: false,
);
}
@override
Widget build(BuildContext context) {
return new charts.BarChart(
seriesList,
animate: animate,
// Optionally turn off the animation that animates values up from the
// bottom of the domain axis. If animation is on, the bars will animate up
// and then animate to the final viewport.
animationDuration: Duration.zero,
// Set the initial viewport by providing a new AxisSpec with the
// desired viewport: a starting domain and the data size.
domainAxis: new charts.OrdinalAxisSpec(
viewport: new charts.OrdinalViewport('2018', 4)),
behaviors: [
// Add this behavior to show initial hint animation that will pan to the
// final desired viewport.
// The duration of the animation can be adjusted by pass in
// [hintDuration]. By default this is 3000ms.
new charts.InitialHintBehavior(maxHintTranslate: 4.0),
// Optionally add a pan or pan and zoom behavior.
// If pan/zoom is not added, the viewport specified remains the viewport
new charts.PanAndZoomBehavior(),
],
);
}
/// Create one series with sample hard coded data.
static List<charts.Series<OrdinalSales, String>> _createSampleData() {
final data = [
new OrdinalSales('2014', 5),
new OrdinalSales('2015', 25),
new OrdinalSales('2016', 100),
new OrdinalSales('2017', 75),
new OrdinalSales('2018', 33),
new OrdinalSales('2019', 80),
new OrdinalSales('2020', 21),
new OrdinalSales('2021', 77),
new OrdinalSales('2022', 8),
new OrdinalSales('2023', 12),
new OrdinalSales('2024', 42),
new OrdinalSales('2025', 70),
new OrdinalSales('2026', 77),
new OrdinalSales('2027', 55),
new OrdinalSales('2028', 19),
new OrdinalSales('2029', 66),
new OrdinalSales('2030', 27),
];
return [
new charts.Series<OrdinalSales, String>(
id: 'Sales',
colorFn: (_, __) => charts.MaterialPalette.blue.shadeDefault,
domainFn: (OrdinalSales sales, _) => sales.year,
measureFn: (OrdinalSales sales, _) => sales.sales,
data: data,
)
];
}
}
/// Sample ordinal data type.
class OrdinalSales {
final String year;
final int sales;
OrdinalSales(this.year, this.sales);
}