charts
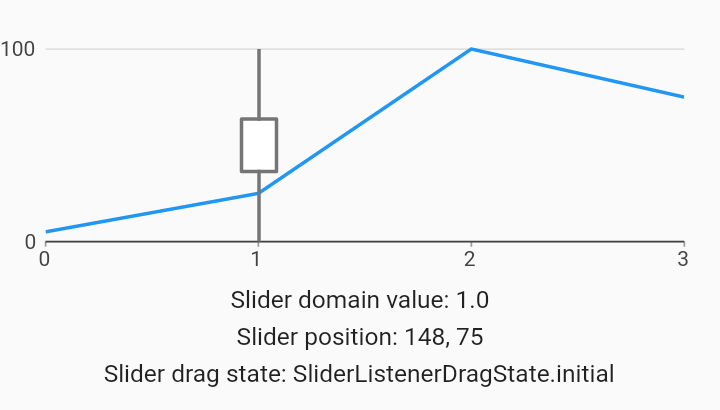
Slider Behaviors Example
Example:
import 'dart:math';
// EXCLUDE_FROM_GALLERY_DOCS_END
import 'package:charts_flutter/flutter.dart' as charts;
import 'package:flutter/material.dart';
import 'package:flutter/rendering.dart';
import 'package:flutter/scheduler.dart';

/// This is just a simple line chart with a behavior that adds slider controls.
///
/// A [Slider] behavior is added manually to enable slider controls, with an
/// initial position at 1 along the domain axis.
///
/// An onChange event handler has been configured to demonstrate updating a div
/// with data from the slider's current position. An "initial" drag state event
/// will be fired when the chart is drawn because an initial domain value is
/// set.
///
/// [Slider.moveSliderToDomain] can be called to programmatically position the
/// slider. This is useful for synchronizing the slider with external elements.
class SliderLine extends StatefulWidget {
  final List<charts.Series> seriesList;
  final bool animate;

  SliderLine(this.seriesList, {this.animate});

  /// Creates a [LineChart] with sample data and no transition.
  factory SliderLine.withSampleData() {
    return new SliderLine(
      _createSampleData(),
      // Disable animations for image tests.
      animate: false,
    );
  }


  // We need a Stateful widget to build the selection details with the current
  // selection as the state.
  @override
  State<StatefulWidget> createState() => new _SliderCallbackState();

  /// Create one series with sample hard coded data.
  static List<charts.Series<LinearSales, int>> _createSampleData() {
    final data = [
      new LinearSales(0, 5),
      new LinearSales(1, 25),
      new LinearSales(2, 100),
      new LinearSales(3, 75),
    ];

    return [
      new charts.Series<LinearSales, int>(
        id: 'Sales',
        domainFn: (LinearSales sales, _) => sales.year,
        measureFn: (LinearSales sales, _) => sales.sales,
        data: data,
      )
    ];
  }
}

class _SliderCallbackState extends State<SliderLine> {
  num _sliderDomainValue;
  String _sliderDragState;
  Point<int> _sliderPosition;

  // Handles callbacks when the user drags the slider.
  _onSliderChange(Point<int> point, dynamic domain, String roleId,
      charts.SliderListenerDragState dragState) {
    // Request a build.
    void rebuild(_) {
      setState(() {
        _sliderDomainValue = (domain * 10).round() / 10;
        _sliderDragState = dragState.toString();
        _sliderPosition = point;
      });
    }

    SchedulerBinding.instance.addPostFrameCallback(rebuild);
  }

  @override
  Widget build(BuildContext context) {
    // The children consist of a Chart and Text widgets below to hold the info.
    final children = <Widget>[
      new SizedBox(
          height: 150.0,
          child: new charts.LineChart(
            widget.seriesList,
            animate: widget.animate,
            // Configures a [Slider] behavior.
            //
            // Available options include:
            //
            // [eventTrigger] configures the type of mouse gesture that controls
            // the slider.
            //
            // [handleRenderer] draws a handle for the slider. Defaults to a
            // rectangle.
            //
            // [initialDomainValue] sets the initial position of the slider in
            // domain units. The default is the center of the chart.
            //
            // [onChangeCallback] will be called when the position of the slider
            // changes during a drag event.
            //
            // [roleId] optional custom role ID for the slider. This can be used to
            // allow multiple [Slider] behaviors on the same chart. Normally, there can
            // only be one slider (per event trigger type) on a chart. This setting
            // allows for configuring multiple independent sliders.
            //
            // [snapToDatum] configures the slider to snap snap onto the nearest
            // datum (by domain distance) when dragged. By default, the slider
            // can be positioned anywhere along the domain axis.
            //
            // [style] takes in a [SliderStyle] configuration object, and
            // configures the color and sizing of the slider line and handle.
            behaviors: [
              new charts.Slider(
                  initialDomainValue: 1.0, onChangeCallback: _onSliderChange),
            ],
          )),
    ];

    // If there is a slider change event, then include the details.
    if (_sliderDomainValue != null) {
      children.add(new Padding(
          padding: new EdgeInsets.only(top: 5.0),
          child: new Text('Slider domain value: ${_sliderDomainValue}')));
    }
    if (_sliderPosition != null) {
      children.add(new Padding(
          padding: new EdgeInsets.only(top: 5.0),
          child: new Text(
              'Slider position: ${_sliderPosition.x}, ${_sliderPosition.y}')));
    }
    if (_sliderDragState != null) {
      children.add(new Padding(
          padding: new EdgeInsets.only(top: 5.0),
          child: new Text('Slider drag state: ${_sliderDragState}')));
    }

    return new Column(children: children);
  }
}

/// Sample linear data type.
class LinearSales {
  final int year;
  final int sales;

  LinearSales(this.year, this.sales);
}