Testing Code
No matter how careful the engineers developing your software are, some mistakes and overlooked edge cases are inevitable. Unexpected input combinations may cause data corruption or result in availability issues like the “Query of Death” example in Chapter 22 of the SRE book. Coding errors can cause security problems like buffer overflows and cross-site scripting vulnerabilities. Put simply, there are many ways software is prone to failure in the real world.
The techniques discussed in this chapter, used in different stages and contexts of software development, have a variety of cost–benefit profiles.1 For example, fuzzing—sending random requests to a system—can help you harden that system in terms of both security and reliability. This technique can potentially help you catch information leaks and reduce serving errors by exposing the service to a multitude of edge cases. To identify potential bugs in systems that you can’t patch easily and quickly, you’ll likely need to perform thorough up-front testing.
Unit Testing
Unit testing can increase system security and reliability by pinpointing a wide range of bugs in individual software components before a release. This technique involves breaking software components into smaller, self-contained “units” that have no external dependencies, and then testing each unit. Unit tests consist of code that exercises a given unit with different inputs selected by the engineer writing the test. Popular unit test frameworks are available for many languages; systems based on the xUnit architecture are very common.
Frameworks following the xUnit paradigm allow common setup and teardown code to execute with each individual test method. These frameworks also define roles and responsibilities for individual testing framework components that help standardize the test result format. That way, other systems have detailed information about what exactly went wrong. Popular examples include JUnit for Java, GoogleTest for C++, go2xunit for Golang, and the built-in unittest module in Python.
example_onethree_onedot_unit_test_for_a is a simple unit test written using the GoogleTest framework.
Unit test for a function that checks whether the provided argument is a prime number, written using the GoogleTest framework
TEST(IsPrimeTest, Trivial) {
  EXPECT_FALSE(IsPrime(0));
  EXPECT_FALSE(IsPrime(1));
  EXPECT_TRUE(IsPrime(2));
  EXPECT_TRUE(IsPrime(3));
}
Unit tests typically run locally as part of engineering workflows to provide fast feedback to developers before they submit changes to the codebase. In continuous integration/continuous delivery (CI/CD) pipelines, unit tests often run before a commit is merged into a repository’s mainline branch. This practice attempts to prevent code changes that break behavior that other teams rely on.
Writing Effective Unit Tests
The quality and comprehensiveness of unit tests can significantly impact the robustness of your software. Unit tests should be fast and reliable to give engineers immediate feedback on whether a change has broken expected behavior. By writing and maintaining unit tests, you can ensure that as engineers add new features and code, they do not break existing behavior covered by the relevant tests. As discussed in Chapter 9, your tests should also be hermetic—if a test can’t repeatedly produce the same results in an isolated environment, you can’t necessarily rely on the test results.
Consider a system that manages the amount of storage bytes a team can use in a given datacenter or region. Suppose that the system allows teams to request additional quota if the datacenter has available unallocated bytes. A simple unit test might involve validating requests for quota in a set of imaginary clusters partially occupied by imaginary teams, rejecting requests that would exceed the available storage capacity. Security-focused unit tests might check how requests involving negative amounts of bytes are handled, or how the code handles capacity overflows for large transfers that result in quota values near the limit of the variable types used to represent them. Another unit test might check whether the system returns an appropriate error message when sent malicious or malformed input.
It’s often useful to test the same code with different parameters or environmental data, such as the initial starting quota usages in our example. To minimize the amount of duplicated code, unit test frameworks or languages often provide a way to invoke the same test with different parameters. This approach helps reduce duplicate boilerplate code, which can make refactoring efforts less tedious.
When to Write Unit Tests
A common strategy is to write tests shortly after writing the code, using the tests to verify that the code performs as expected. These tests typically accompany the new code in the same commit, and often encompass the cases that the engineer writing the code checked manually. For instance, our example storage management application might require that “Only billing administrators for the group that owns the service can request more quota.” You can translate this type of requirement into several unit tests.
In organizations that practice code review, a peer reviewer can double-check the tests to ensure they’re sufficiently robust to maintain the quality of the codebase. For example, a reviewer may notice that although new tests accompany a change, the tests may pass even if the new code is removed or inactive. If a reviewer can replace a statement like if (condition_1 || condition_2) with if (false) or if (true) in the new code, and none of the new tests fail, then the test may have overlooked important test cases. For more information about Google’s experience with automating this kind of mutation testing, see Petrović and Ivanković (2018).2
Instead of writing tests after writing code, test-driven development (TDD) methodologies encourage engineers to write unit tests based on established requirements and expected behaviors before writing code. When testing new features or bug fixes, the tests will fail until the behavior is completely implemented. Once a feature is implemented and the tests pass, engineers progress to the next feature, where the process repeats.
For existing projects that weren’t built using TDD models, it is common to slowly integrate and improve test coverage in response to bug reports or proactive efforts to increase confidence in a system. But even once you achieve full coverage, your project isn’t necessarily bug-free. Unknown edge cases or sparsely implemented error handling can still cause incorrect behavior.
You can also write unit tests in response to internal manual testing or code review efforts. You might write these tests during standard development and review practices, or during milestones like a security review before a launch. New unit tests can verify that a proposed bug fix works as expected, and that later refactoring won’t reintroduce the same bug. This type of testing is particularly important if the code is hard to reason about and potential bugs impact security—for example, when writing access control checks in a system with a complicated permission model.
In the interest of covering as many scenarios as possible, you’ll often spend more time writing tests than writing the code being tested—especially when dealing with nontrivial systems. This extra time pays off in the long run, since early testing yields a higher-quality codebase with fewer edge cases to debug.
How Unit Testing Affects Code
To improve the comprehensiveness of your tests, you may need to design new code to include testing provisions, or refactor older code to make it more testable. Typically, refactoring involves providing a way to intercept calls to external systems. Using that introspection ability, you can test code in a variety of ways—for example, to verify that the code invokes the interceptor the correct number of times, or with the correct arguments.
Consider how you might test a piece of code that opens tickets in a remote issue tracker when certain conditions are met. Creating a real ticket every time the unit test runs would generate unnecessary noise. Even worse, this testing strategy may fail randomly if the issue tracker system is unavailable, violating the goal of quick, reliable test results.
To refactor this code, you could remove direct calls to the issue tracker service and replace those calls with an abstraction—for example, an interface for an IssueTrackerService object. The implementation for testing could record data when it receives calls such as “Create an issue,” and the test could inspect that metadata to make a pass or fail conclusion. By contrast, the production implementation would connect to remote systems and call the exposed API methods.
This refactor dramatically reduces the “flakiness” of a test that depends on real-world systems. Because they rely on behavior that isn’t guaranteed—like an external dependency, or the order of elements when retrieving items from some container types—flaky tests are often more of a nuisance than a help. Try to fix flaky tests as they arise; otherwise, developers may get in the habit of ignoring test results when checking in changes.
These abstractions and their corresponding implementations are called mocks, stubs, or fakes. Engineers sometimes use these words interchangeably, despite the fact that the concepts vary in implementation complexity and features, so it’s important to ensure everyone at your organization uses consistent vocabulary. If you practice code review or use style guides, you can help reduce confusion by providing definitions that teams can align around.
It’s easy to fall into the trap of overabstraction, where tests assert mechanical facts about the order of function calls or their arguments. Overly abstracted tests often don’t provide much value, as they tend to “test” the language’s control flow implementation rather than the behavior of the systems you care about.
If you have to completely rewrite your tests every time a method changes, you may need to rethink the tests—or even the architecture of the system itself. To help avoid constant test rewrites, you might consider asking engineers familiar with the service to provide suitable fake implementations for any nontrivial testing needs. This solution is advantageous to both the team responsible for the system and the engineers testing the code: the team that owns the abstraction can ensure it tracks the feature set of the service as it evolves, and the team using the abstraction now has a more realistic component to use in its tests.3
Integration Testing
Integration testing moves beyond individual units and abstractions, replacing fake or stubbed-out implementations of abstractions like databases or network services with real implementations. As a result, integration tests exercise more complete code paths. Because you must initialize and configure these other dependencies, integration testing may be slower and flakier than unit testing—to execute the test, this approach incorporates real-world variables like network latency as services communicate end-to-end. As you move from testing individual low-level units of code to testing how they interact when composed together, the net result is a higher degree of confidence that the system is behaving as expected.
Integration testing takes different shapes, which are determined by the complexity of the dependencies they address. When the dependencies that integration testing needs are relatively simple, an integration test may look like a base class that sets up a few shared dependencies (for example, a database in a preconfigured state) from which other tests extend. As services grow in complexity, integration tests can become far more complex, requiring supervising systems to orchestrate the initialization or setup of dependencies to support the test. Google has teams focused exclusively on infrastructure that enables standardized integration test setup for common infrastructure services. For organizations using a continuous build and delivery system like Jenkins, integration tests may run either alongside or separately from unit tests, depending on the size of the codebase and the number of available tests in a project.
As you build integration tests, keep the principles discussed in Chapter 5 in mind: make sure the data and systems access requirements of the tests don’t introduce security risks. It can be tempting to mirror actual databases into test environments since the databases provide a rich set of real-world data, but you should avoid this anti-pattern because they may contain sensitive data that will be available to anyone running tests that use those databases. Such an implementation is inconsistent with the principle of least privilege and may pose a security risk. Instead, you can seed these systems with nonsensitive test data. This approach also makes it easy to wipe test environments to a known clean state, reducing the likelihood of integration test flakiness.
Writing Effective Integration Tests
Like unit tests, integration tests may be influenced by design choices in your code. To continue with our earlier example of an issue tracker that files tickets, a unit test mock may simply assert that the method was invoked to file a ticket with the remote service. An integration test would more likely use a real client library. Rather than creating spurious bugs in production, the integration test would communicate with a QA endpoint. Test cases would exercise the application logic with inputs that cause calls to the QA instance. Supervising logic could then query the QA instance to verify that externally visible actions took place successfully from an end-to-end perspective.
Understanding why integration tests fail when all unit tests pass can require a lot of time and energy. Good logging at key logical junctures of your integration tests can help you debug and understand where breakdowns occur. Bear in mind too that because integration tests go beyond individual units by examining interactions between components, they can tell you only a limited amount about how well those units will conform to your expectations in other scenarios. This is one of the many reasons using each type of testing in your development lifecycle adds value—one form of testing is often not a substitute for another.
Dynamic Program Analysis
Program analysis allows users to carry out a number of useful actions—for example, performance profiling, checking for security-related correctness, code coverage reporting, and dead code elimination. As discussed later in this chapter, you can perform program analysis statically to investigate software without executing it. Here, we focus on dynamic approaches. Dynamic program analysis analyzes software by running programs, potentially in virtualized or emulated environments, for purposes beyond just testing.
Performance profilers (which are used to find performance issues in programs) and code coverage report generators are the best-known types of dynamic analysis. The previous chapter introduced the dynamic program analysis tool Valgrind, which provides a virtual machine and various tools to interpret a binary and check whether an execution exhibits various common bugs. This section focuses on dynamic analysis approaches that rely on compiler support (often called instrumentation) to detect memory-related errors.
Compilers and dynamic program analysis tools let you configure instrumentation to collect runtime statistics on the binaries that the compilers produce, such as performance profiling information, code coverage information, and profile-based optimizations. The compiler inserts additional instructions and callbacks to a backend runtime library that surfaces and collects the relevant information when the binary is executed. Here, we focus on security-relevant memory misuse bugs for C/C++ programs.
The Google Sanitizers suite provides compilation-based dynamic analysis tools. They were initially developed as part of the LLVM compiler infrastructure to capture common programming mistakes, and are now supported by GCC and other compilers, as well. For example, AddressSanitizer (ASan) finds a number of common memory-related bugs, such as out-of-bounds memory accesses, in C/C++ programs. Other popular sanitizers include the following:
- UndefinedBehaviorSanitizer
- Performs runtime flagging of undefined behavior
- ThreadSanitizer
- Detects race conditions
- MemorySanitizer
- Detects reading of uninitialized memory
- LeakSanitizer
- Detects memory leaks and other types of leaks
As new hardware features allow tagging of memory addresses, there are proposals to use those new features to further improve the performance of ASan.
ASan provides fast performance by building a custom, instrumented binary of the program under analysis. During compilation, ASan adds certain instructions to make callbacks into the provided sanitizer runtime. The runtime maintains metadata about the program execution—for example, which memory addresses are valid to access. ASan uses a shadow memory to record whether a given byte is safe for the program to access, and uses compiler-inserted instructions to check the shadow memory when the program tries to read or write that byte. It also provides custom memory allocation and deallocation (malloc and free) implementations. For example, the malloc function allocates additional memory immediately before and after the returned requested memory region. This creates a buffer memory region that allows ASan to easily report buffer overflows and underflows with precise information about what went wrong and where. To do so, ASan marks these regions (also called red zones) as poisoned. Similarly, ASan marks memory that was freed as poisoned, allowing you to catch use-after-free bugs easily.
The following example illustrates a simple run of ASan, using the Clang compiler. The shell commands instrument and run a particular input file with a use-after-free bug, which occurs when a memory address belonging to a previously deallocated memory region is read. A security exploit can use this type of access as a building block. The option -fsanitize=address turns on the ASan instrumentation:
$ cat -n use-after-free.c
 1  #include <stdlib.h>
 2  int main() {
 3    char *x = (char*)calloc(10, sizeof(char));
 4    free(x);
 5    return x[5];
 6  }

$ clang -fsanitize=address -O1 -fno-omit-frame-pointer -g use-after-free.c
After the compilation finishes, we can see the error report ASan produces when executing the generated binary. (For the sake of brevity, we’ve omitted the full ASan error message.) Note that ASan allows error reports to indicate the source file information, such as line numbers, by using the LLVM symbolizer, as described in the “Symbolizing the Reports” section of the Clang documentation. As you can see in the output report, ASan finds a 1-byte use-after-free read access (emphasis added). The error message includes information for the original allocation, the deallocation, and the subsequent illegal use:
% ./a.out
=================================================================
==142161==ERROR: AddressSanitizer: heap-use-after-free on address 0x602000000015
at pc 0x00000050b550 bp 0x7ffc5a603f70 sp 0x7ffc5a603f68
READ of size 1 at 0x602000000015 thread T0
    #0 0x50b54f in main use-after-free.c:5:10
    #1 0x7f89ddd6452a in __libc_start_main
    #2 0x41c049 in _start

0x602000000015 is located 5 bytes inside of 10-byte region [0x602000000010,0x60200000001a)
freed by thread T0 here:
    #0 0x4d14e8 in free
    #1 0x50b51f in main use-after-free.c:4:3
    #2 0x7f89ddd6452a in __libc_start_main

previously allocated by thread T0 here:
    #0 0x4d18a8 in calloc
    #1 0x50b514 in main use-after-free.c:3:20
    #2 0x7f89ddd6452a in __libc_start_main

SUMMARY: AddressSanitizer: heap-use-after-free use-after-free.c:5:10 in main
[...]
==142161==ABORTING
Fuzz Testing
Fuzz testing (often referred to as fuzzing) is a technique that complements the previously mentioned testing strategies. Fuzzing involves using a fuzz engine (or fuzzer) to generate large numbers of candidate inputs that are then passed through a fuzz driver to the fuzz target (the code that processes the inputs). The fuzzer then analyzes how the system handles the input. Complex inputs handled by all kinds of software are popular targets for fuzzing—for example, file parsers, compression algorithm implementations, network protocol implementations, and audio codecs.
You can also use fuzzing to evaluate different implementations of the same functionality. For example, if you are considering moving from library A to library B, a fuzzer can generate inputs, pass them to each library for processing, and compare the results. The fuzzer can report any nonmatching result as a “crash,” which can help engineers determine what subtle behavior changes may result. This crash-on-different-outputs action is typically implemented as part of the fuzz driver, as seen in OpenSSL’s BigNum fuzzer.5
Since fuzzing can execute indefinitely, it’s not feasible to block every commit on the results of an extended test. This means that when the fuzzer finds a bug, that bug may already be checked in. Ideally, other testing or analysis strategies will have prevented the bug in the first place, so fuzzing acts as a complement by generating test cases that engineers may not have considered. As an added benefit, another unit test can use the generated input samples that identify bugs in the fuzz target to ensure that later changes don’t regress the fix.
How Fuzz Engines Work
Fuzz engines can vary in complexity and sophistication. At the low end of the spectrum, a technique often referred to as dumb fuzzing simply reads bytes from a random number generator and passes them to the fuzz target in an attempt to find bugs. Fuzz engines have grown increasingly smart through integration with compiler toolchains. They can now generate more interesting and meaningful samples by taking advantage of the compiler instrumentation features discussed earlier. It is considered a good industry practice to use as many fuzz engines as you can integrate into your build toolchain, and to monitor metrics like the percentage of code covered. If code coverage plateaus at some point, it’s usually worth investigating why the fuzzer can’t reach other areas.
Some fuzz engines accept dictionaries of interesting keywords from the specifications or grammars of well-specified protocols, languages, and formats (like HTTP, SQL, and JSON). The fuzz engine can then generate input that’s likely to be accepted by the program under test, since the input may simply be rejected by generated parser code if it contains illegal keywords. Providing a dictionary increases the likelihood of reaching the code you actually want to test through fuzzing. Otherwise, you may end up exercising code that rejects input based on invalid tokens and never finds any interesting bugs.
Fuzz engines like Peach Fuzzer allow a fuzz driver author to programmatically define the format of the input and the expected relationships between fields, so the fuzz engine can generate test cases that violate those relationships. Fuzz engines also commonly accept a set of sample input files, referred to as a seed corpus, that are representative of what the code being fuzzed expects. The fuzz engine then mutates these seed inputs, in addition to carrying out any other supported input generation strategies. Some software packages come with sample files (such as MP3s for audio libraries or JPEGs for image processing) as part of their existing test suites—these sample files are great candidates for a seed corpus. Otherwise, you can curate a seed corpus from real-world or hand-generated files. Security researchers also publish seed corpora for popular file formats, such as those provided by the following:
In recent years, improvements to compiler toolchains have resulted in significant advancements toward making smarter fuzz engines. For C/C++, compilers such as LLVM Clang can instrument the code (as discussed earlier) to allow the fuzz engine to observe what code is executed while processing a specific sample input. When the fuzz engine finds a new code path, it preserves the samples that prompted the code path and uses them to generate future samples. Other languages or fuzz engines may require a specific compiler—such as afl-gcc for AFL or go-fuzz-build for the go-fuzz engine—to properly trace the execution paths to increase code coverage.
When a fuzz engine generates an input that caused a crash in a sanitizer-instrumented code path, it records the input along with metadata extracted from the program in the crashed state. This metadata can include information such as a stack trace indicating what line of code caused the crash, or the process’s memory layout at the time. This information provides engineers with details about the cause of the crash, which can help them understand its nature, prepare fixes, or prioritize bugs. For example, when an organization is considering how to prioritize fixes for different types of issues, a memory read access violation may be considered less critical than a write access violation. Such prioritization contributes to a culture of security and reliability (see Chapter 21).
The way your program reacts when the fuzz engine provokes a potential bug depends on a wide variety of circumstances. A fuzz engine is most effective at detecting bugs if encountering them prompts consistent and well-defined events—for example, receiving a signal or executing a specific function when memory corruption or undefined behavior occurs. These functions can explicitly signal the fuzz engine when the system reaches a particular error state. Many of the sanitizers mentioned earlier work this way.
Some fuzz engines also allow you to set an upper time bound for processing a particular generated input. If, for example, a deadlock or infinite loop causes an input to exceed the time limit, the fuzzer categorizes the sample as “crashing.” It also saves that sample for further investigation so development teams can prevent DoS issues that might render the service unavailable.
The Heartbleed bug (CVE-2014-0160) that caused web servers to leak memory (including memory containing TLS certificates or cookies) can be identified relatively quickly by fuzzing with the right fuzz driver and sanitizer. Google’s fuzzer-test-suite GitHub repository contains an example Dockerfile that demonstrates successful identification of the bug. Here is an excerpt of the ASan report for the Heartbleed bug, provoked by the __asan_memcpy function call that the sanitizer compiler plug-in inserted (emphasis added):
==19==ERROR: AddressSanitizer: heap-buffer-overflow on address 0x629000009748 at pc
0x0000004e59c9 bp 0x7ffe3a541360 sp 0x7ffe3a540b10
READ of size 65535 at 0x629000009748 thread T0
    #0 0x4e59c8 in __asan_memcpy /tmp/final/llvm.src/projects/compiler-rt/lib/asan/asan_interceptors_memintrinsics.cc:23:3
    #1 0x522e88 in tls1_process_heartbeat /root/heartbleed/BUILD/ssl/t1_lib.c:2586:3
    #2 0x58f94d in ssl3_read_bytes /root/heartbleed/BUILD/ssl/s3_pkt.c:1092:4
    #3 0x59418a in ssl3_get_message /root/heartbleed/BUILD/ssl/s3_both.c:457:7
    #4 0x55f3c7 in ssl3_get_client_hello /root/heartbleed/BUILD/ssl/s3_srvr.c:941:4
    #5 0x55b429 in ssl3_accept /root/heartbleed/BUILD/ssl/s3_srvr.c:357:9
    #6 0x51664d in LLVMFuzzerTestOneInput /root/FTS/openssl-1.0.1f/target.cc:34:3
[...]

0x629000009748 is located 0 bytes to the right of 17736-byte region [0x629000005200,
0x629000009748)
allocated by thread T0 here:
    #0 0x4e68e3 in __interceptor_malloc /tmp/final/llvm.src/projects/compiler-rt/lib/asan/asan_malloc_linux.cc:88:3
    #1 0x5c42cb in CRYPTO_malloc /root/heartbleed/BUILD/crypto/mem.c:308:8
    #2 0x5956c9 in freelist_extract /root/heartbleed/BUILD/ssl/s3_both.c:708:12
    #3 0x5956c9 in ssl3_setup_read_buffer /root/heartbleed/BUILD/ssl/s3_both.c:770
    #4 0x595cac in ssl3_setup_buffers /root/heartbleed/BUILD/ssl/s3_both.c:827:7
    #5 0x55bff4 in ssl3_accept /root/heartbleed/BUILD/ssl/s3_srvr.c:292:9
    #6 0x51664d in LLVMFuzzerTestOneInput /root/FTS/openssl-1.0.1f/target.cc:34:3
[...]
The first portion of the output describes the type of issue (in this case, heap-buffer-overflow—specifically, a read access violation) and an easy-to-read symbolized stack trace pointing to the exact line of code that reads beyond the allocated buffer size. The second portion contains metadata about a nearby memory region and how it was allocated to help an engineer analyze the issue and understand how the process reached the invalid state.
The compiler and sanitizer instrumentation make this analysis possible. However, this instrumentation has limits: fuzzing with sanitizers doesn’t work as well when some portions of the software are handwritten assembly for performance reasons. The compiler can’t instrument the assembly code because the sanitizer plug-ins operate at a higher layer. As such, the handwritten assembly code that does not get instrumented may be responsible for false positives or undetected bugs.
Fuzzing entirely without sanitizers is possible, but it diminishes your ability to detect invalid program states and the metadata available to analyze a crash. For example, in order for fuzzing to produce any useful information if you’re not using a sanitizer, the program must encounter an “undefined behavior” scenario, and then signal this error state to the external fuzz engine (typically by crashing or exiting). Otherwise, the undefined behavior carries on undetected. Likewise, if you’re not using ASan or similar instrumentation, your fuzzer may not identify states where memory has been corrupted but is not used in a way that causes the operating system to terminate the process.
If you are working with libraries that are only available in binary form, compiler instrumentation is not an option. Some fuzz engines, like American Fuzzy Lop, also integrate with processor emulators like QEMU to instrument interesting instructions at the CPU level. This type of integration may be an appealing option for binary-only libraries you need to fuzz, at the expense of speed. This approach allows the fuzz engine to understand which code paths a generated input might prompt when compared to another generated input, but does not provide as much bug detection assistance as source code builds with compiler-added sanitizer instructions.
Many modern fuzz engines, like libFuzzer, AFL, and Honggfuzz, use some combination of the previously described techniques, or variations of these techniques. It’s possible to build a single fuzz driver that works with multiple fuzz engines. When working with multiple fuzz engines, it’s a good idea to make sure that you periodically move interesting input samples generated by each one back into the seed corpus that the other fuzz engines are configured to use. One engine might be successful at taking an input generated by another engine, mutating it, and causing a crash.
Writing Effective Fuzz Drivers
To make these fuzzing concepts more concrete, we’ll go into more detail about a fuzz driver using the framework provided by LLVM’s libFuzzer engine, which is included with the Clang compiler. This particular framework is convenient because other fuzz engines (like Honggfuzz and AFL) also work with the libFuzzer entry point. As a fuzzer author, using this framework means you only have to write a single driver that implements the function prototype:
int LLVMFuzzerTestOneInput(const uint8_t *data, size_t size);
The respective fuzz engines will then generate byte sequences and invoke your driver, which can pass the input to the code you want to test.
The goal of the fuzz engines is to execute the fuzz target via the driver as quickly as possible with as many unique and interesting inputs as they can generate. To enable reproducible crashes and quick fuzzing, try to avoid the following in your fuzz drivers:
Nondeterministic behavior, such as relying on random number generators or specific multithreading behavior.
Slow operations, like console logging or disk I/O. Instead, consider creating “fuzzer-friendly” builds that disable these slow operations, or using a memory-based filesystem.
Crashing intentionally. The idea behind fuzzing is to find crashes you didn’t intend to have. The fuzz engine can’t disambiguate intentional crashes.
These properties can also be desirable for the other types of testing described in this chapter.
You should also avoid any specialized integrity checks (like CRC32 or message digests) that an adversary can “fix up” in a generated input sample. The fuzz engine is unlikely to ever produce a valid checksum and pass the integrity check without specialized logic. A common convention is to use compiler preprocessor flags like -DFUZZING_BUILD_MODE_UNSAFE_FOR_PRODUCTION to enable this fuzzer-friendly behavior and to help reproduce crashes identified through fuzzing.
An Example Fuzzer
This section follows the steps of writing a fuzzer for a simple open source C++ library called Knusperli. Knusperli is a JPEG decoder that might see a wide range of input if it’s encoding user uploads or processing images (including potentially malicious images) from the web.
Knusperli also provides a convenient interface for us to fuzz: a function that accepts a sequence of bytes (the JPEG) and size parameter, as well as a parameter that controls which sections of the image to parse. For software that does not expose such a straightforward interface, you can use helper libraries like FuzzedDataProvider to help transform the byte sequence into useful values for the target interface. Our example fuzz driver targets this function:
bool ReadJpeg(const uint8_t* data, const size_t len, JpegReadMode mode,
              JPEGData* jpg);
Knusperli builds with the Bazel build system. By modifying your .bazelrc file, you can create a convenient shorthand way to build targets using the various sanitizers, and build libFuzzer-based fuzzers directly. Here’s an example for ASan:
$ cat ~/.bazelrc
build:asan --copt -fsanitize=address --copt -O1 --copt -g -c dbg
build:asan --linkopt -fsanitize=address --copt -O1 --copt -g -c dbg
build:asan --copt -fno-omit-frame-pointer --copt -O1 --copt -g -c dbg
At this point, you should be able to build a version of the tool with ASan enabled:
$ CC=clang-6.0 CXX=clang++-6.0 bazel build --config=asan :knusperli
You can also add a rule to the BUILD file for the fuzzer we’re about to write:
cc_binary(
    name = "fuzzer",
    srcs = [
        "jpeg_decoder_fuzzer.cc",
    ],
    deps = [
        ":jpeg_data_decoder",
        ":jpeg_data_reader",
    ],
    linkopts = ["-fsanitize=address,fuzzer"],
)
example_onethree_twodot_jpeg_decoder_fu shows what a simple attempt at the fuzz driver might look like.
jpeg_decoder_fuzzer.cc
 1  #include <cstddef>
 2  #include <cstdint>
 3  #include "jpeg_data_decoder.h"
 4  #include "jpeg_data_reader.h"
 5
 6  extern "C" int LLVMFuzzerTestOneInput(const uint8_t *data, size_t sz) {
 7    knusperli::JPEGData jpg;
 8    knusperli::ReadJpeg(data, sz, knusperli::JPEG_READ_HEADER, &jpg);
 9      return 0;
10  }
We can build and run the fuzz driver with these commands:
$ CC=clang-6.0 CXX=clang++-6.0 bazel build --config=asan :fuzzer
$ mkdir synthetic_corpus
$ ASAN_SYMBOLIZER_PATH=/usr/lib/llvm-6.0/bin/llvm-symbolizer bazel-bin/fuzzer \
  -max_total_time 300 -print_final_stats synthetic_corpus/
The preceding command runs the fuzzer for five minutes using an empty input corpus. LibFuzzer places interesting generated samples in the synthetic_corpus/ directory to use in future fuzzing sessions. You receive the following results:
[...]
INFO:        0 files found in synthetic_corpus/
INFO: -max_len is not provided; libFuzzer will not generate inputs larger than
4096 bytes
INFO: A corpus is not provided, starting from an empty corpus
#2      INITED cov: 110 ft: 111 corp: 1/1b exec/s: 0 rss: 36Mb
[...]
#3138182       DONE   cov: 151 ft: 418 corp: 30/4340b exec/s: 10425 rss: 463Mb
[...]
Done 3138182 runs in 301 second(s)
stat::number_of_executed_units: 3138182
stat::average_exec_per_sec:     10425
stat::new_units_added:          608
stat::slowest_unit_time_sec:    0
stat::peak_rss_mb:              463
Adding a JPEG file—for example, the color bar pattern seen on broadcast TV—to the seed corpus also results in improvements. That single seed input brings >10% improvement in the code blocks executed (the cov metric):
#2 INITED cov: 169 ft: 170 corp: 1/8632b exec/s: 0 rss: 37Mb
To reach even more code, we can use different values for the JpegReadMode parameter. The valid values are as follows:
enum JpegReadMode {
  JPEG_READ_HEADER,   // only basic headers
  JPEG_READ_TABLES,   // headers and tables (quant, Huffman, ...)
  JPEG_READ_ALL,      // everything
};
Rather than writing three different fuzzers, we can hash a subset of the input and use that result to exercise different combinations of library features in a single fuzzer. Be careful to use enough input to create a varied hash output. If the file format mandates that the first N bytes of an input all look the same, use at least one more than N when deciding what bytes will influence which options to set.
Other approaches include using the previously mentioned FuzzedDataProvider to split the input, or dedicating the first few bytes of input to setting the library parameters. The remaining bytes are then passed as the input to the fuzz target. Whereas hashing the input may result in wildly different configuration if a single input bit changes, the alternative approaches to splitting the input allow the fuzz engine to better track the relationship between the selected options and the way the code behaves. Be mindful of how these different approaches can affect the usability of potential existing seed inputs. In this case, imagine that you create a new pseudoformat by deciding to rely on the first few input bytes to set the options to the library. As a result, you can no longer easily use all the existing JPEG files in the world as possible seed inputs, unless you first preprocess the files to add initial parameters.
To explore the idea of configuring the library as a function of the generated input sample, we’ll use the number of bits set in the first 64 bytes of input to select a JpegReadMode, as illustrated in #example_onethree_threedot_fuzzing_by_sp.
Fuzzing by splitting the input
  #include <cstddef>
  #include <cstdint>
  #include "jpeg_data_decoder.h"
  #include "jpeg_data_reader.h"

  const unsigned int kInspectBytes = 64;
  const unsigned int kInspectBlocks = kInspectBytes / sizeof(unsigned int);

  extern "C" int LLVMFuzzerTestOneInput(const uint8_t *data, size_t sz) {
   knusperli::JPEGData jpg;
   knusperli::JpegReadMode rm;
   unsigned int bits = 0;

   if (sz <= kInspectBytes) {  // Bail on too-small inputs.
     return 0;
   }

   for (unsigned int block = 0; block < kInspectBlocks; block++) {
     bits +=
       __builtin_popcount(reinterpret_cast<const unsigned int *>(data)[block]);
   }

   rm = static_cast<knusperli::JpegReadMode>(bits %
                                             (knusperli::JPEG_READ_ALL + 1));

   knusperli::ReadJpeg(data, sz, rm, &jpg);

   return 0;
 }
When using the color bar as the only input corpus for five minutes, this fuzzer gives the following results:
#851071 DONE   cov: 196 ft: 559 corp: 51/29Kb exec/s: 2827 rss: 812Mb
[...]
Done 851071 runs in 301 second(s)
stat::number_of_executed_units: 851071
stat::average_exec_per_sec:     2827
stat::new_units_added:          1120
stat::slowest_unit_time_sec:    0
stat::peak_rss_mb:              812
Executions per second have dropped because the changes enable more features of the library, causing this fuzz driver to reach much more code (indicated by the rising cov metric). If you run the fuzzer without any time-out limits, it will continue to generate inputs indefinitely until the code provokes a sanitizer error condition. At that point, you will see a report like the one shown earlier for the Heartbleed bug. You can then make code changes, rebuild, and run the fuzzer binary that you built with the saved artifact as a way to reproduce the crash or to verify that the code change will fix the issue.
Continuous Fuzzing
Once you have written some fuzzers, running them regularly over a codebase as it’s developed can provide a valuable feedback loop to engineers. A continuous build pipeline can generate daily builds of fuzzers in your codebase to be consumed by a system that runs the fuzzers, collects crash information, and files bugs in an issue tracker. Engineering teams can use the results to focus on identifying vulnerabilities or eliminating root causes that make the service miss its SLO.
Example: ClusterFuzz and OSSFuzz
ClusterFuzz is an open source implementation of a scalable fuzzing infrastructure released by Google. It manages pools of virtual machines that run fuzzing tasks and provides a web interface to view information about the fuzzers. ClusterFuzz does not build fuzzers, but instead expects a continuous build/integration pipeline to push fuzzers to a Google Cloud Storage bucket. It also provides services like corpus management, crash deduplication, and lifecycle management for the crashes that it identifies. The heuristics ClusterFuzz uses for crash deduplication are based on the state of the program at the time of the crash. By preserving the samples that cause a crash, ClusterFuzz can also periodically retest these issues to determine whether they still reproduce, and automatically close the issue when the latest version of the fuzzer no longer crashes on the offending sample.
The ClusterFuzz web interface shows metrics you can use to understand how well a given fuzzer is performing. The metrics available depend on what’s exported by the fuzz engines integrated into your build pipeline (as of early 2020, ClusterFuzz supports libFuzzer and AFL). The ClusterFuzz documentation provides instructions for extracting code coverage information from fuzzers built with Clang code coverage support, then converting that information into a format you can store in a Google Cloud Storage bucket and display in the frontend. Using this functionality to explore the code covered by the fuzzer written in the previous section would be a good next step for determining additional improvements to the input corpus or fuzz driver.
OSS-Fuzz combines modern fuzzing techniques with a scalable distributed execution of ClusterFuzz that’s hosted on the Google Cloud Platform. It uncovers security vulnerabilities and stability issues, and reports them directly to developers—within five months of its launch in December 2016, OSS-Fuzz had discovered over a thousand bugs, and since then it has found tens of thousands more.
Once a project is integrated with OSS-Fuzz, the tool uses continuous and automated testing to find issues only hours after modified code is introduced into the upstream repository, before any users are affected. At Google, by unifying and automating our fuzzing tools, we’ve consolidated our processes into a single workflow based on OSS-Fuzz. These integrated OSS projects also benefit from being reviewed by both Google’s internal tools and external fuzzing tools. Our integrated approach increases code coverage and discovers bugs faster, improving the security posture of Google projects and the open source ecosystem.
Static Program Analysis
Static analysis is a means of analyzing and understanding computer programs by inspecting their source code without executing or running them. Static analyzers parse the source code and build an internal representation of the program that’s suitable for automated analysis. This approach can discover potential bugs in source code, preferably before the code is checked in or deployed in production. Numerous tools are available for various languages, as well as tools for cross-language analyses.
Static analysis tools make different tradeoffs between depth of analysis versus cost of analyzing the source code. For example, the shallowest analyzers perform simple textual or abstract syntax tree (AST)–based pattern matches. Other techniques rely on reasoning about a program’s state-based semantic constructs, and basing that reasoning on the program’s control flow and data flow.
Tools also target different analysis tradeoffs between false positives (incorrect warnings) and false negatives (missed warnings). Tradeoffs are unavoidable, partially because of the fundamental limit to static analysis: statically verifying any program is an undecidable problem—that is, it is not possible to develop an algorithm that can determine whether any given program will execute without violating any given property.
Given that constraint, tool providers focus on generating useful signals for developers at various stages of development. Depending on the integration point for static analysis engines, different tradeoffs with respect to analysis speed and expected analysis feedback are acceptable. For example, a static analysis tool that’s integrated within a code review system will likely target only newly developed source code, and will issue precise warnings that focus on very probable issues. On the other hand, source code undergoing a final predeployment release analysis for a safety-critical program (e.g., for domains like avionics software or medical device software with potential governmental certification requirements) may require more formal and stricter analysis.6
The following sections present static analysis techniques adapted for various needs during different stages of the development process. We highlight automated code inspection tools, abstract interpretation–based tools (this process is sometimes referred to as deep static analysis), and more resource-intensive approaches, such as formal methods. We also discuss how to integrate static analyzers into developer workflows.
Automated Code Inspection Tools
Automated code inspection tools perform a syntactic analysis of source code with respect to language features and usage rules. These tools, commonly referred to as linters, generally don’t model complex program behaviors like interprocedural data flow. Because they perform relatively shallow analysis, the tools scale easily to arbitrary code sizes—they can often complete their source code analysis in about the same amount of time it takes to compile the code. Code inspection tools are also easily extensible—you can simply add new rules that cover many types of bugs, especially bugs related to language features.
Over the past few years, code inspection tools have focused on stylistic and readability changes, because such code improvement suggestions have a high acceptance rate by developers. Many organizations enforce style and format checks by default in order to maintain a cohesive codebase that’s easier to manage across large developer teams. These organizations also routinely run checks that reveal potential code smells and highly likely bugs.
The following example focuses on tools that perform one particular type of analysis—AST pattern matching. An AST is a tree representation of a program’s source code based on the syntactic structure of the programming language. Compilers commonly parse a given source code input file into such a representation, and then manipulate that representation during the compilation process. For example, an AST may contain a node representing an if-then-else construct, which has three child nodes: one node for the condition of the if statement, one node representing the subtree for the then branch, and another node representing the subtree of the else branch.
Error Prone for Java and Clang-Tidy for C/C++ are widely used across projects at Google. Both of these analyzers allow engineers to add custom checks. For example, as of early 2018, 162 authors had submitted 733 checks to Error Prone. For certain types of bugs, both Error Prone and Clang-Tidy can produce suggested fixes. Some compilers (like Clang and MSVC) also support the community-developed C++ core guidelines. With help from the Guideline Support Library (GSL), these guidelines prevent many common mistakes in C++ programs.
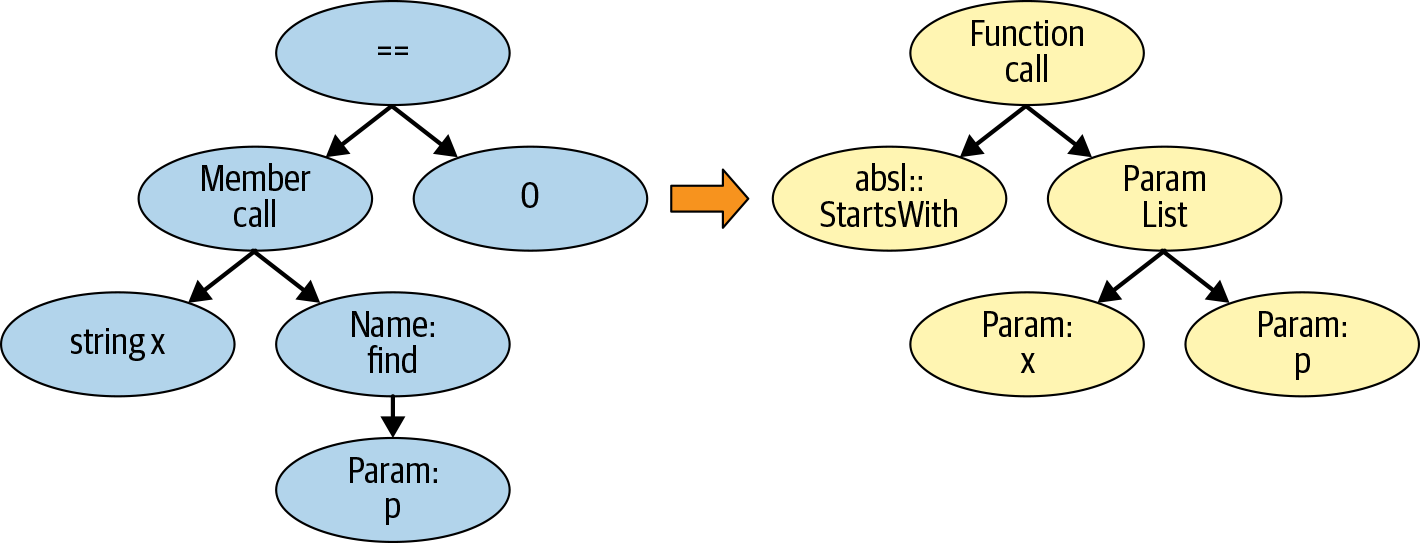
AST pattern-matching tools allow users to add new checks by writing rules on the parsed AST. For example, consider the absl-string-find-startsWith Clang-Tidy warning. The tool attempts to improve the readability and performance of code that checks for string prefix matches using the C++ string::find API: Clang-Tidy recommends using the StartsWith API provided by ABSL instead. To perform its analysis, the tool creates an AST subtree pattern that compares the output of the C++ string::find API with the integer value 0. The Clang-Tidy infrastructure provides the tooling to find AST subtree patterns in the AST representation of the program being analyzed.
Consider the following code snippet:
std::string s = "...";
if (s.find("Hello World") == 0) { /* do something */ }
The absl-string-find-startsWith Clang-Tidy warning flags this code snippet and suggests that the code be changed in the following way:
std::string s = "...";
if (absl::StartsWith(s, "Hello World")) { /* do something */ }
In order to suggest a fix, Clang-Tidy (conceptually speaking) provides the capability to transform an AST subtree, given a pattern. The left side of Figure 13-1 shows an AST pattern match. (The AST subtree is simplified for the sake of clarity.) If the tool finds a matching AST subtree in the parse AST tree of the source code, it notifies the developer. AST nodes also contain line and column information, which allows the AST pattern-matcher to report a specific warning to the developer.
In addition to performance and readability checks, Clang-Tidy also provides many common bug pattern checks. Consider running Clang-Tidy on the following input files:7
$ cat -n sizeof.c
 1  #include <string.h>
 2  const char* kMessage = "Hello World!";
 3  int main() {
 4    char buf[128];
 5    memcpy(buf, kMessage, sizeof(kMessage));
 6    return 0;
 7  }

$ clang-tidy sizeof.c
[...]
Running without flags.
1 warning generated.
sizeof.c:5:32: warning: 'memcpy' call operates on objects of type 'const char'
while the size is based on a different type 'const char *'
[clang-diagnostic-sizeof-pointer-memaccess]
  memcpy(buf, kMessage, sizeof(kMessage));
                               ^
sizeof.c:5:32: note: did you mean to provide an explicit length?
  memcpy(buf, kMessage, sizeof(kMessage));

$ cat -n sizeof2.c
 1  #include <string.h>
 2  const char kMessage[] = "Hello World!";
 3  int main() {
 4    char buf[128];
 5    memcpy(buf, kMessage, sizeof(kMessage));
 6    return 0;
 7  }

$ clang-tidy sizeof2.c
[...]
Running without flags.
The two input files differ only in the type declaration of kMessage. When kMessage is defined as a pointer to initialized memory, sizeof(kMessage) returns the size of a pointer type. Therefore, Clang-Tidy produces the clang-diagnostic-sizeof-pointer-memaccess warning. On the other hand, when kMessage is of type const char[], the sizeof(kMessage) operation returns the appropriate, expected length, and Clang-Tidy doesn’t produce a warning.
For some pattern checks, in addition to reporting a warning, Clang-Tidy can suggest code fixes. The absl-string-find-startsWith Clang-Tidy warning suggestion presented earlier is one such instance. The righthand side of Figure 13-1 shows the appropriate AST-level replacement. When such suggestions are available, you can tell Clang-Tidy to automatically apply them to the input file, using the --fix command-line option.
You can also use automatically applied suggestions to update a codebase using the Clang-Tidy modernize fixes. Consider the following sequence of commands, which showcases the modernize-use-nullptr pattern. The sequence finds instances of zero-constants used for pointer assignments or comparisons, and changes them to use nullptr instead. In order to run all modernize checks, we use Clang-Tidy with the option --checks=modernize-*; then --fix applies the suggestions to the input file. At the end of the sequence of commands, we highlight the four changes by printing the transformed file (emphasis added):
$ cat -n nullptr.cc
 1  #define NULL 0x0
 2
 3  int *ret_ptr() {
 4    return 0;
 5  }
 6
 7  int main() {
 8    char *a = NULL;
 9    char *b = 0;
10    char c = 0;
11    int *d = ret_ptr();
12    return d == NULL ? 0 : 1;
13  }

$ clang-tidy nullptr.cc -checks=modernize-* --fix
[...]
Running without flags.
4 warnings generated.
nullptr.cc:4:10: warning: use nullptr [modernize-use-nullptr]
  return 0;
         ^
         nullptr
nullptr.cc:4:10: note: FIX-IT applied suggested code changes
  return 0;
         ^
nullptr.cc:8:13: warning: use nullptr [modernize-use-nullptr]
  char *a = NULL;
            ^
            nullptr
nullptr.cc:8:13: note: FIX-IT applied suggested code changes
  char *a = NULL;
            ^
nullptr.cc:9:13: warning: use nullptr [modernize-use-nullptr]
  char *b = 0;
            ^
            nullptr
nullptr.cc:9:13: note: FIX-IT applied suggested code changes
  char *b = 0;
            ^
nullptr.cc:12:15: warning: use nullptr [modernize-use-nullptr]
  return d == NULL ? 0 : 1;
              ^
              nullptr
nullptr.cc:12:15: note: FIX-IT applied suggested code changes
  return d == NULL ? 0 : 1;
              ^
clang-tidy applied 4 of 4 suggested fixes.

$ cat -n nullptr.cc
 1  #define NULL 0x0
 2
 3  int *ret_ptr() {
 4    return nullptr;
 5  }
 6
 7  int main() {
 8    char *a = nullptr;
 9    char *b = nullptr;
10    char c = 0;
11    int *d = ret_ptr();
12    return d == nullptr ? 0 : 1;
13  }
Other languages have similar automated code inspection tools. For example, GoVet analyzes Go source code for common suspicious constructs, Pylint analyzes Python code, and Error Prone provides analysis and auto-fix capabilities for Java programs. The following example briefly demonstrates running Error Prone via Bazel build rule (emphasis added). In Java, the subtraction operation i-1 on the variable i of type Short returns a value of type int. Therefore, it is infeasible for the remove operation to succeed:
$ cat -n ShortSet.java
 1  import java.util.Set;
 2  import java.util.HashSet;
 3
 4  public class ShortSet {
 5    public static void main (String[] args) {
 6      Set<Short> s = new HashSet<>();
 7      for (short i = 0; i < 100; i++) {
 8        s.add(i);
 9        s.remove(i - 1);
10      }
11      System.out.println(s.size());
12    }
13  }

$ bazel build :hello
ERROR: example/myproject/BUILD:29:1: Java compilation in rule '//example/myproject:hello'
ShortSet.java:9: error: [CollectionIncompatibleType] Argument 'i - 1' should not be
passed to this method;
its type int is not compatible with its collection's type argument Short
      s.remove(i - 1);
              ^
    (see http://errorprone.info/bugpattern/CollectionIncompatibleType)
1 error
Integration of Static Analysis in the Developer Workflow
It’s considered good industry practice to run relatively fast static analysis tools as early as possible in the development cycle. Finding bugs early is important because the cost of fixing them increases substantially if they’re pushed into the source code repository or deployed to users.
There’s a low barrier to integrating static analysis tools into your CI/CD pipeline, with a potentially high positive impact on the productivity of your engineers. For example, a developer can get an error and a suggestion about how to fix null pointer dereferencing. And if they can’t push their code, they can’t forget to fix the issue and accidentally cause the system to crash or expose information, which contributes to a culture of security and reliability (see Chapter 21).
To this end, Google developed the Tricorder program analysis platform8 and an open-source version of Tricorder called Shipshape. Tricorder performs static analysis of approximately 50,000 code review changes per day. The platform runs many types of program analysis tools and surfaces warnings to developers during code review, when they are accustomed to evaluating suggestions. The tools aim to provide code findings that are easy to understand and easy to fix, with a low user-perceived false-positive rate (10%, at most).
Tricorder is designed to allow users to run many different program analysis tools. As of early 2018, the platform included 146 analyzers covering over 30 source languages. Most of these analyzers were contributed by Google developers. Generally speaking, commonly available static analysis tools are not very complex. Most checkers run by Tricorder are automated code inspection tools. These tools target a variety of languages, check for conformance to coding style guidelines, and find bugs. As previously mentioned, Error Prone and Clang-Tidy can produce suggested fixes in certain scenarios. The code author can then apply the fixes with the click of a button.
Figure 13-2 shows a screenshot of Tricorder analysis results for a given Java input file, as presented to a code reviewer. The results show two warnings, one from the Java linter and one from Error Prone. Tricorder measures the user-perceived false-positive rate by allowing code reviewers to provide feedback on surfaced warnings via a “Not useful” link. The Tricorder team uses these signals to disable individual checks. The code reviewer can also send a request to the code author to “Please fix” an individual warning.
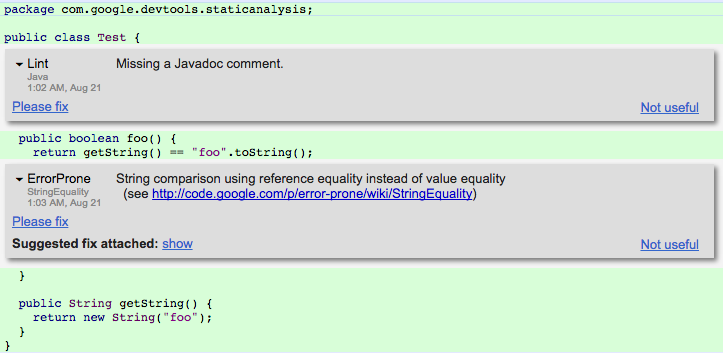
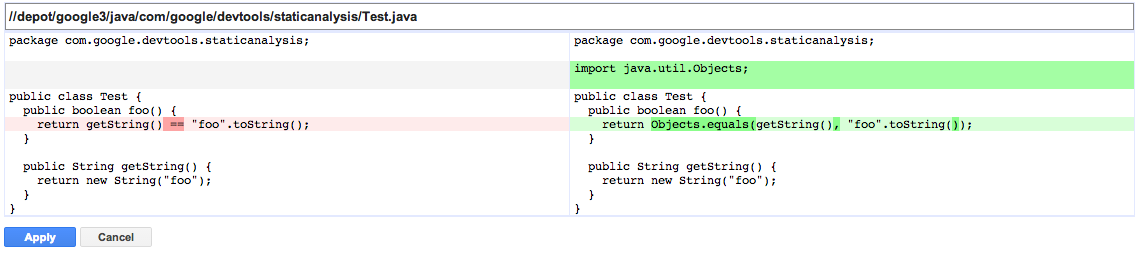
Figure 13-3 shows the automatically applied code changes suggested by Error Prone during code review.
Abstract Interpretation
Abstract interpretation–based tools statically perform a semantic analysis of program behaviors.9 This technique has been used successfully to verify safety-critical software, such as flight control software.10 Consider the simple example of a program that generates the 10 smallest positive even integers. During its regular execution, the program generates the integer values 2, 4, 6, 8, 10, 12, 14, 16, 18, and 20. In order to allow efficient static analysis of such a program, we want to summarize all the possible values using a compact representation that covers all the observed values. Using the so-called interval or range domain, we can represent all observed values using the abstract interval value [2, 20] instead. The interval domain allows the static analyzer to reason efficiently about all program executions by simply remembering the lowest and highest possible values.
In order to ensure that we’re capturing all possible program behaviors, it’s important to cover all observed values with the abstract representation. However, this approach also introduces an approximation that may lead to imprecision, or false warnings. For example, if we wanted to guarantee that the actual program never produces the value 11, an analysis using an integer domain would lead to a false positive.
Static analyzers utilizing abstract interpretation generally compute an abstract value for every program point. To do so, they rely on a control-flow graph (CFG) representation of a program. CFGs are commonly used during compiler optimizations, and to statically analyze programs. Each node in a CFG represents a basic block in the program, which corresponds to a sequence of program statements that are always executed in order. That is, there are no jumps from within this sequence of statements, and no jump targets in the middle of the sequence. Edges in a CFG represent control flow in the program, where a jump occurs either through intraprocedural control flow—for example, due to if statements or loop constructs—or interprocedural control flow due to function calls. Note that the CFG representation is also used by coverage-guided fuzzers (discussed previously). For instance, libFuzzer keeps track of which basic blocks and edges are covered during fuzzing. The fuzzer uses this information to decide whether to consider an input for future mutations.
Abstract interpretation–based tools perform a semantic analysis that reasons about data flow and control flow in programs, often across function calls. For that reason, they take much longer to run than the previously discussed automated code inspection tools. While you can integrate automated code inspection tools into interactive development environments such as code editors, abstract interpretation is generally not similarly integrated. Instead, developers might run abstract interpretation–based tools on committed code occasionally (nightly, for example), or during code review in differential settings, analyzing only the changed code while reusing analysis facts for unchanged code.
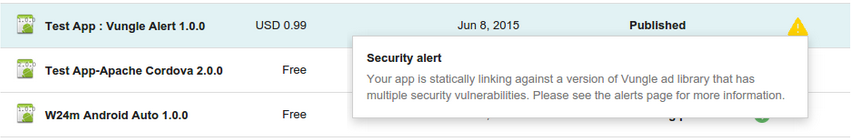
A number of tools rely on abstract interpretation for a variety of languages and properties. For example, the Frama-C tool allows you to find common runtime errors and assertion violations including buffer overflows, segmentation faults due to dangling or null pointers, and division by zero in programs written in C. As previously discussed, these types of bugs—especially memory-related bugs—can have security implications. The Infer tool reasons about memory and pointer changes performed by programs and can find bugs like dangling pointers in Java, C, and other languages. The AbsInt tool can perform worst-case execution time analysis of tasks in real-time systems. The App Security Improvement (ASI) program performs a sophisticated interprocedural analysis on every Android app that’s uploaded to the Google Play Store, for safety and security. If it finds a vulnerability, ASI flags the vulnerability and presents suggestions for addressing the issue. Figure 13-4 shows a sample security alert. As of early 2019, this program had led to over one million app fixes in the Play Store by over 300,000 app developers.
Formal Methods
Formal methods allow users to specify properties of interest for software or hardware systems. Most of these are so-called safety properties that specify that a certain bad behavior should never be observable. For example, “bad behavior” can include assertions in programs. Others include liveness properties, which allow users to specify a desired outcome—for example, that a submitted print job is eventually processed by a printer. Users of formal methods can verify these properties for particular systems or models, and even develop such systems using correct-by-construction–based approaches. As highlighted in Analyzing Invariants, formal methods–based approaches often have a relatively high up-front cost. This is partially because these approaches require an a priori description of system requirements and properties of interest. These requirements must be specified in a mathematically rigorous and formal way.
Formal methods–based techniques have been successfully integrated into hardware design and verification tools.11 In hardware design, it is now standard practice to use formal or semiformal tools provided by electronic design automation (EDA) vendors. These techniques have also been successfully applied to software in specialized domains, such as safety-critical systems or cryptographic protocol analysis. For example, a formal methods–based approach continuously analyzes the cryptographic protocols used in TLS within computer network communications. 12
Conclusion
Testing software for security and reliability is a vast topic, of which we’ve just scratched the surface. The testing strategies presented in this chapter, combined with practices around writing secure code to eliminate entire bug classes (see Chapter 12), have been key in helping Google teams scale reliably, minimizing outages and security problems. It’s important to build software with testability in mind from the earliest stages of development, and to engage in comprehensive testing throughout the development lifecycle.
At this point, we want to emphasize the value of fully integrating all of these testing and analysis methods into your engineering workflows and CI/CD pipelines. By combining and regularly using these techniques consistently throughout your codebase, you can identify bugs more quickly. You’ll also raise confidence in your ability to detect or prevent bugs when you deploy your applications—a topic covered in the next chapter.