1. Why?
A little work goes a long way.
The tracing framework provides some useful events without any work on your part, but that's only scratching the surface of what's possible with the tool and what data your app has yet to reveal. Though it's certainly useful to see the ways your application is interacting with the browser and vice versa, often there is much more work occurring within your call trees than not.
By adding some simple, easily-removable, (usually) well-isolated instrumentation calls to your application code you can quickly enhance your traces to be more useful both for understanding your program flow and identifying where time is going. The process if instrumenting is currently an iterative, trial-and-error affair but often just a few hours will yield 90% of the available data and get your application in a good state.
The tracing framework is designed to be very low overhead when disabled and the calls can be stripped by most Javascript optimization systems (such as the Google Closure Compiler and UglifyJS 2). Because of this it's encouraged that the instrumentation is checked into source control to enable all developers to run traces on a regular basis, enable automated performance regression tools, and keep your code healthy.
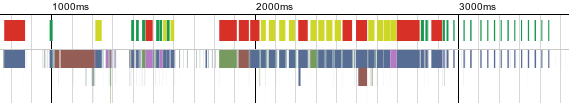
Screenshot of uninstrumented code. Boring.
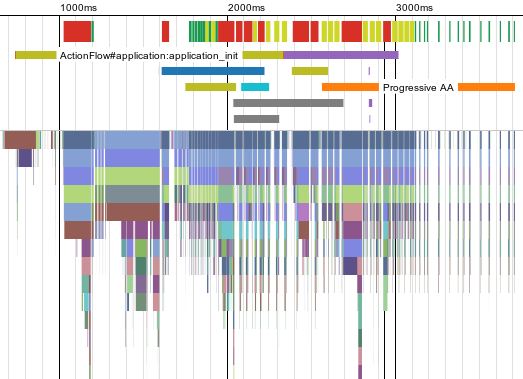
Screenshot of fully instrumented code. Awesome!
2. Shims
There are several shim files provided to make it easier to use the tracing framework library from your Javascript. They will disable all tracing if the library is not injected on a page, ensure that the version of the library matches the expected version, and can enable Javascript optimizers to better remove code. If possible, you should always prefer to use one of these shims to making calls directly into the library.
So, you should not make calls to the wtf global object. This object is only present when the library is on the page. If you make calls to wtf methods without protecting their use your application will not run with the tracing framework missing!
Instead, by using one of the shims below, you will have a WTF global object that ensures the methods are always present and do nothing unless the framework is present on the page. Javascript engines and most optimizers are good at doing the right thing here and this will not have a measurable performance impact on your code.
Obtaining the Shims
The shims are hosted in the Github repository and are designed to be copied into your project and checked into your own source control. This way when a new version of the tracing framework is deployed your applications will not break as it would have if you referenced the Github versions directly. Simply pick the shim you need from the list below and save it!
Using a Shim
Once you've saved your shim file into your project you should bundle it up with any other Javascript as part of your normal build process. It must be the first file included. Depending on your Javascript optimizer your can specify different shim files or configuration options to enable or disable the tracing code at optimization time, resulting in final bundles that contain zero tracing code.
Once a shim is included, you will access all tracing framework APIs via the global WTF object, not the lower-case wtf object.
if (WTF.PRESENT) {
  // The tracing framework is injected onto this page!
} else {
  // All calls through WTF will be ignored.
}

// This will do nothing when the library is not injected, otherwise it will record an event.
// Optimizing compilers can remove this entire line from the code if configured correctly.
WTF.trace.timeStamp('hello!');
For normal Javascript
Shim file: wtf-trace.js
This shim is useful if using WTF from regular Javascript, node.js applications, or in conjunction with most Javascript optimizers. When added to a page the WTF object will always be present regardless of whether the framework is injected on the page.
For UglifyJS 2 Users
Shim files: wtf-trace.js, wtf-trace-disabled.js
If you're using UglifyJS 2 to optimize your release-mode Javascript you have the option of stripping all tracing calls when you don't want them. It's recommended that you produce an optimized bundle both with and without the tracing code enabled so that you can get realistic performance numbers from your optimized script and then ship the stripped file to users.
To do this, use the wtf-trace.js when building a myapp-traced.js bundle. All of your calls to WTF.trace.* APIs will be retained through optimization and you'll be able to load your pages and get good numbers.
When it comes time to ship code to users switch to using wtf-trace-disabled.js and pass the --compress option to strip all calls to WTF.trace.* APIs. This (should) remove any hint of tracing framework usage.
For Closure Compiler Users
Shim file: wtf-trace-closure.js
This shim provides a Closure Compiler compatible WTF namespace that can be used in your code with type safety and all of the compilers awesome optimizations. By default the tracing calls will be included in built Javascript bundles but when the advanced compilation mode is used and --define=WTF.ENABLED=false is passed on the command line all traces of the WTF calls will be removed.
3. Events in Traces
Events in the tracing framework come in two types: scopes and instances. Instance events denote that something occurred, but not how long it took. Scope events denote a time range when something was occurring and can nest within each other.
All events are defined by a name. These names are literal-like, in that they cannot contain spaces or many other special characters. Generally, if a name can be used as a variable name in Javascript it can be used as an event name in WTF. In addition to the normal allowed characters, however, there are a few additional supported to enable JSDoc-like names. This allows tools and the UI to handle things like classes and and callbacks.
// Valid names:
'someEvent'
'my.namespaces.someEvent'
'my.Type#someEvent'
'callingFunction:callback'

// Invalid names:
'things with strings!'
'/slashes/are/bad\'
'avoid|pipes|too'
Instance Events
Screenshot showing an instance event and its tooltip.
It's often useful to record the occurrence of an event or some data for something that does not represent a time span. Instance events allow this in an efficient way and make it easy to filter and query trace files for the values.
Instances are recorded by the built-in WTF.trace.timeStamp API or custom instance event types. Prefer using the custom types to reduce tracing overhead.
Scope Events
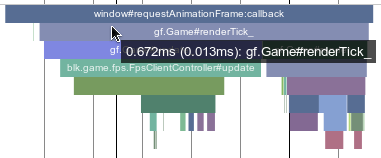
Screenshot showing scope events and ones tooltip.
In most traces scopes are equivalent to function calls: a scope for function X starts when X is called and ends when X returns. They are the most useful type of events and the ones you'll see most often. The time duration of scopes is marked with an enter and a leave. Scopes can be nested with other scopes and instance events.
Scopes are recorded by either the built-in WTF.trace.enterScope API, custom scope event types, or automatic instrumentation of functions and types. Prefer using the custom types or automatic instrumentation to reduce tracing overhead.
Important Scopes cannot overlap. You cannot leave a parent scope without first leaving a nested child scope. Bad things will happen.
4. Built-in Events
There are several helper methods in the API that make it really easy to trace new events without any event setup. They're super handy when exploring the performance characteristics of code and events need to be added and removed frequently.
But beware: these untyped event functions are slow. They can be up to 10x slower than using the custom event types as described below. They're great for debugging, but try to avoid checking them in!
Instance Events
WTF.trace.timeStamp(string name, any opt_value)
// Records an instance event named 'didSomething' with some value.
// The value is optional and can be any JSONable type (number/string/object/etc).
WTF.trace.timeStamp('didSomething', someObject.value);
Scope Events
WTF.trace.enterScope(string name) -> Scope
WTF.trace.leaveScope(Scope scope, any opt_result)
Enters a scope by name. This must be matched with a WTF.trace.leaveScope call.
It is strongly recommended that a custom enter scope event should be used instead of this, as the overhead required to write the scope name is non-trivial. Only use this when the name changes many times at runtime or you're hacking something together. See WTF.trace.events.createScope.
function myFunction() {
  var scope = WTF.trace.enterScope('myFunction');
  // Do some work...
  WTF.trace.leaveScope(scope);
}
function myFunction() {
  var scope = WTF.trace.enterScope('myFunction');
  // Do some work...
  var result = ...;
  return WTF.trace.leaveScope(scope, result);
}
Adding Arguments to Scopes
WTF.trace.appendScopeData(string name, any value)
Appends a named argument of any type to the current scope. The data added is keyed by name, and existing data with the same name will be overwritten. This is slow and should only be used for very infrequent appends.
No, really, this JSON stringifies whatever is passed to it and will skew your results. Don't use it. Instead use custom event types.
Though it's strongly recommended you use the custom event types if you need arguments, you can add ad-hoc arguments to the current scope at any time.
var scope = WTF.trace.enterScope('someScope');
WTF.trace.appendScopeData('bar', 123);
WTF.trace.appendScopeData('foo', {
  'complex': ['data']
});
WTF.trace.leaveScope(scope);
5. Custom Events
WTF.trace.events.createInstance(string signature, opt_flags)
WTF.trace.events.createScope(string signature, opt_flags)
Custom events are defined by a function signature that can be a simple string such as 'myEvent' or a JSDoc name like 'my.namespace.Type#methodName'. Optionally it can include typed parameters like 'myEvent(uint32 a, ascii b)'.
You create the event functions with a call to createInstance or createScope, depending on the type of event you want, and then cache the returned function for later use. Note that it can be expensive to create the event functions, so only do it once during startup.
Once you have the cached function, you call it as it was defined by the signature you provided. For example, a simple signature like 'myEvent' takes no arguments, so the function takes none either.
When tracing is disabled the creation functions will always return a no-op function. This lets you continue to make calls on the events without worrying about the calls breaking when the framework is not active.
Unless you're using automatic instrumentation you'll want to create and reuse event functions instead of using the built in WTF.trace.enterScope and WTF.trace.timeStamp methods. When using the event functions Javascript is generated at runtime to efficiently pack the events and their arguments into a binary format that is incredibly fast to record.
// Create the events once, statically.
// This allows for optimized code generation and a faster recording time.
my.Type.fooEvent_ = wtf.trace.events.createInstance(
    'my.Type#foo(uint32 a, ascii b)');
my.Type.someMethodEvent_ = wtf.trace.events.createScope(
    'my.Type#someMethod()');

my.Type.prototype.someMethod = function() {
  // Enter the custom scope:
  var scope = my.Type.someMethodEvent_();
  // Trace the event with custom arguments:
  my.Type.fooEvent_(123, 'hello');
  // Leave the scope, as normal.
  WTF.trace.leaveScope(scope);
};
Event Signatures
The signatures used by events look like function signatures in many languages. They are a name plus some optional number of typed arguments in parentheses. For naming rules, see the event naming note above.
| Name | Example Signature | Example Call |
|---|---|---|
| bool | 'myEvent(bool a)' |
myEvent(true); |
| int8/uint8 | 'myEvent(uint8 a)' |
myEvent(123); |
| int16/uint16 | 'myEvent(uint16 a)' |
myEvent(12345); |
| int32/uint32 | 'myEvent(uint32 a)' |
myEvent(1234567); |
| float32 | 'myEvent(float32 a)' |
myEvent(5.4); |
| ascii/utf8 | 'myEvent(ascii a)' |
myEvent('hello'); |
| any | 'myEvent(any a)' |
myEvent({hello: ['world']}); |
Arrays of most of the basic types are also supported. You should use typed arrays if possible to ensure good performance. For example:
var arrayEvent = wtf.trace.events.createInstance('foo(uint32[] a)');
var myArray = new Uint32Array(128);
arrayEvent(myArray);
Note that the time it takes to record each argument type increases as the table goes down. Booleans are 10x faster to encode than floating point numbers, and ASCII strings are much faster to encode than UTF8 ones. You should avoid using 'any', which JSONifies the input, more than a few times per frame.
6. Automatic Instrumentation
Instrumenting every function manually is tedious and can hurt readability. To make things easier the framework provides some automatic instrumentation utility methods that make wrapping functions in scope events much easier. It keeps your code cleaner and is easier to add/remove.
There is, however, a more significant performance impact for wrapping the methods like this, requiring an additional function call per normal call. In most applications this won't matter much so long as you are careful with how many instrumented calls you make per frame. Be careful not to exceed a few hundred or the overhead will skew the results.
Instrumenting Functions
WTF.trace.instrument(function method, string signature)
Use this to instrument single methods, such as callbacks passed to API functions or event handlers.
// Manually instrumenting a method:
var someCallEvent = WTF.trace.events.createScope('someCall(uint32 a, uint32 b)');
function someCall(a, b) {
  var scope = someCallEvent(a, b);
  var result = a + b;
  return WTF.trace.leaveScope(scope, result);
};

// Or, for the (about) same performance impact, make it much more readable:
var someCall = WTF.trace.instrument(function(a, b) {
  return a + b;
}, 'someCall(uint32 a, uint32 b)');
More examples and usage:
// Simplly instrument a method:
var someCall = WTF.trace.instrument(function(a, b) {
  return a + b;
}, 'someCall');

// Instrument an individual method, capturing arguments:
var someCall = WTF.trace.instrument(function(a, b) {
  return a + b;
}, 'someCall(uint32 a, uint32 b)');

// Instrument an individual method on a prototype:
// (if you do this a lot it's best to instrument the type)
myType.prototype['someCall'] = WTF.trace.instrument(
    myType.prototype['someCall'],
    'MyType#someCall(uint32 a, uint32 b)');
Instrumenting Types
WTF.trace.instrumentType(function ctor, string ctorSignature, object methods)
The WTF.trace.instrumentType method can be used to quickly instrument a constructor and several prototype methods with optional argument recording. It's good practice to place this under a class definition.
// Some type.
var MyType = function(a, b) {
  this.value = a + b;
};
MyType.prototype.foo = function(a) {
  return a;
};

// A simpler version, not tracing the arguments:
MyType = WTF.trace.instrumentType(
  MyType, 'MyType', {
    foo: 'foo'
  });

// Automatically instrument the constructor and the 'foo' method.
// This records the given argument values (with a slight performance overhead).
MyType = WTF.trace.instrumentType(
    MyType, 'MyType(uint8 a, uint8 b)', {
      foo: 'foo(uint8 a)'
    });
Instrumenting Closure Types
When using the tracing framework in Closure annotated code it's possible to get a compact and rich form of the auto instrumentation that supports the advanced renaming options of the compiler. Use the example in the following snippet.
The Closure Compiler is smart enough, with this syntax, to still perform dead code removal on unused prototype methods and rename used methods while preserving the real name in traces.
// Some properly constructed Closure type.
// Be sure to use goog.base when inheriting.
my.Type = function(a, b) {
  goog.base(this);
  this.value = a + b;
};
goog.inherits(my.Type, some.BaseType);
my.Type.prototype.foo = function(a) {
  return a;
};

// Automatically instrument the constructor and the 'foo' method.
// Note where there are and aren't quotes.
my.Type = WTF.trace.instrumentType(
    my.Type, 'my.Type(uint8 a, uint8 b)',
    goog.reflect.object(my.Type, {
      foo: 'foo(uint8 a)'
    }));
7. Navigation Aids
Traces of complex applications can sometimes get difficult to navigate around, especially when looking at a trace file that was saved off days or weeks earlier. By annotating your traces with time ranges and markers it makes it much easier to find the information you're looking for. For example, 'were there slow frames while I was animating?', 'did I perform the same transition twice when I only needed once?', etc.
Frames
The tracing framework will automatically detect the use of requestAnimationFrame and add a frame navigation bar to your traces as well as detecting other useful statistics. This makes it really easy to find where frames are running too long or being skipped. If you're running animations, be sure to use requestAnimationFrame for the best performance and these tools!
TIP: z and x move between frames.
TIP: hold shift when using z and x to also include time between frames.
TIP: ctrl-g lets you quickly jump to a specific frame number.
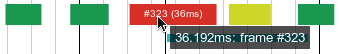
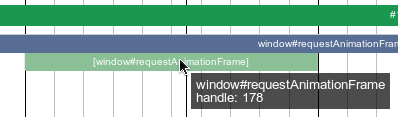
Screenshot showing the frame bar.
Time Ranges
WTF.trace.beginTimeRange(string name, any opt_value) -> TimeRange
WTF.trace.endTimeRange(TimeRange timeRange)
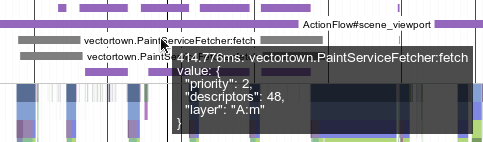
Screenshot showing many time ranges and a tooltip.
It's often useful to see what and how many async operations such as animations or deeply nested network operations are occurring at any given time in a trace. To enable this navigation aid there is a simple API for denoting an async time range. This is not intended to track every detail or stage of an async operation - instead see flows - but makes it easier to help answer questions such as 'when was I animating?' or 'how many updates were processing?' when looking at a trace file.
A limited number of active time ranges will be displayed in the UI. Do not abuse this feature by adding time ranges for everything (like network requests). Prefer to use flows to track complex async operations.
// Begin tracking the async time range at the start:
my.AnimationType.startJob = function(actionName) {
  var job = {...};
  job.tracingRange = WTF.trace.beginTimeRange('my.Type:job', actionName);
};
// Stop tracking it when done:
my.AnimationType.endJob = function(job) {
  WTF.trace.endTimeRange(job.tracingRange);
};
Marks
WTF.trace.mark(string name)
Screenshot showing some marked regions.
The global timeline can be 'marked' with certain blocks denoting large chunks of time. You can think of these as bookmarks or a table of contents for the trace. This is mostly useful when tracking things like automated performance tests that run through various stages or other global state transitions like intro->menu->game.
There can be only one active mark at a time and any new mark will clear existing ones. Try not to use this too frequently - once every second or so at max, but ideally much less frequently - as the usefulness to navigation it provides is reduced when there are too many.
// ...
WTF.trace.mark('Loading UI');
// ...
WTF.trace.mark('Main Menu');
// ...
WTF.trace.mark('Loading Game');
// ...
WTF.trace.mark('Playing Game');
// ...
8. Tracking Flows
TODO
This feature is currently experimental and not yet implemented.
9. Advanced APIs
There are a few advanced or extra features in the API to make it easier to work with. Not all are documented here.
Getting the Time
The tracing framework attempts to use high-resolution times for all timestamps. Because of this it's not usually possible to compare a value from Date.now with a time captured in a trace snapshot. If you wish to use the same times you can use the WTF.timebase() and WTF.now() APIs to match them up.
// Check to see whether the framework is recording high-resolution times.
// Without them, timing information will be limited to millisecond resolution and not very useful.
if (WTF.hasHighResolutionTimes) {
  // Current browser/app has high-resolution times.
}

// A high-resolution, timebase-relative time (if available).
// Can be used to grab relative times in fractional milliseconds (e.g. 5.2ms).
var startTime = WTF.now();
var elapsedMs = WTF.now() - startTime;

// Correlate times with the wall time (Date.now).
// Because WTF.now() may be high-resolution this could be much more precise than Date.now().
var wallTime = WTF.timebase() + WTF.now();
Ignoring Time
Sometimes there is expensive preparation required for tracing that is not usually present in release builds, such as capturing remote assets to embed in the trace. To remove this time from being counted towards real events you can use the special tracing scope to mark the region.
function myFunction() {
  // Do real work...
  if (WTF.PRESENT) {
    // Need to capture server resource here!
    var scope = WTF.trace.enterTracingScope();
    // Do embedding/etc.
    WTF.trace.leaveScope(scope);
  }
  // Continue doing real work...
};
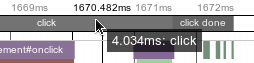
Ignoring DOM Events
To prevent events from debug UI from appearing in your code use one of the ignore APIs. Note that your debug code will still take time and can skew your results, but if trying to analyze program structure ignoring it can make things much cleaner.
// Ignore specific event handlers:
myLink.onclick = WTF.trace.ignoreListener(function(e) {
  // This callback will not be auto-traced.
});
myLink.addEventListener('click', WTF.trace.ignoreListener(function(e) {
  // Also ignored.
}), false);

// Ignore all DOM events from this tree of elements:
var myComplexElement = document.createElement('div');
WTF.trace.ignoreDomTree(myComplexElement);
Zones
All recorded events are attributed to a 'zone'. You can think of zones as threads or processes, though they need not line up. By default the main Javascript thread is assigned a zone (known as the 'default zone'), and additional zones may be created by the framework for things such as Web Workers, the browser internal state, etc. Each zone will appear as a separate track in the UI.
You can create your own zones and attribute events to them to enable tracing across process or server boundaries, isolating work groups, etc. Zones are disambiguated by name and a unique URI, allowing you to either merge zones or split zones from different trace contexts.
// Create a new zone, on startup or wherever.
var customZone = WTF.trace.createZone('zone name', WTF.data.ZoneType.SCRIPT,
    'http://some/unique/URI');

// By default, all events go into the default zone.
WTF.trace.timeStamp('default zone event 1');
WTF.trace.timeStamp('default zone event 2');

// Set the active zone and record some events into it.
WTF.trace.pushZone(customZone);
WTF.trace.timeStamp('custom zone event 1');
WTF.trace.timeStamp('custom zone event 2');

// Restore back to the default zone.
WTF.trace.popZone();
WTF.trace.timeStamp('default zone event 3');
WTF.trace.timeStamp('default zone event 4');

// Delete a zone when no longer required.
WTF.trace.deleteZone(customZone);