|
|
fplutil
An open source project by
FPL.
|
|
|
fplutil
An open source project by
FPL.
|
android_ndk_perf is a desktop tool that enables native (C/C++) developers to measure the CPU utilization of their applications on Android, guiding their optimization efforts.
android_ndk_perf uses Linux Perf to profile the native (C/C++) components of applications on Android. android_ndk_perf can be run on developer's workstations to collect traces of applications running on Android devices. After application traces are collected the data can be examined using Linux Perf's commands or a HTML visualization can be generated for inspection in a web browser.
Examples in the following sections reference the LiquidFun Testbed application as it's moderately complex and provides interesting traces.
In order to use this tool, all prerequisites should be installed.
NOTE: At the moment perfhost binaries are only provided for Linux and OSX. Windows is not yet supported!
Linux Perf is a sampling profiler that by default will sample the location of the instruction pointer at 1KHz. The tool can be used to configure the perf events subsystem in the Linux kernel to sample a wide variety of counters in the system.
Sampling profilers like Linux Perf are very good at providing a broad overview of application performance with very low overhead. Linux Perf is a great tool to determine where time is being spent in an application over a relatively long period of time (e.g seconds).
By constrast, intrusive profilers - where an application is instrumented with timing code - can be more effective at very quickly and accurately determining the overhead of small functions in an application. For example, when optimizing a small function it may be quicker to use an intrusive profiler to measure the number of cycles, cache misses, branch mispredicts etc. in a section of code rather than running the function over a long period of time with a high frequency sampling profiler like Linux Perf.
Application to be profiled must be:
-mapcs-frame option so that stack frames are compliant with the ARM Procedure Call Standard. This makes it possible for Linux Perf to correctly add symbolic function names to instruction pointers in traces.If you're building using fplutil's build_all_android, the process of building and installing LiquidFun's Testbed application with symbols for ARM (v7a) can be performed using the following command:
ndk-build can be used to build LiquidFun Testbed application with symbols for ARM (v7a) with the following commands:
After building the application's native components it needs to be packaged in a debuggable APK:
Finally, the application should be installed on a test device:
After installing an application on a device, it's possible to capture a trace to the directory output/perf.data using android_ndk_perf's record command:
To stop the trace press Ctrl-C (sends the interrupt signal to the process).
The record command performs the following:
bin/testbed-debug.apk.output/perf.dataoutput/ directory.android_ndk_perf's visualize command can be used to generate a HTML report and open the report in a web browser. The trace output/perf.data captured using the record command can be converted to the HTML report report.html and viewed using the following command:
Which generates a report like the following:
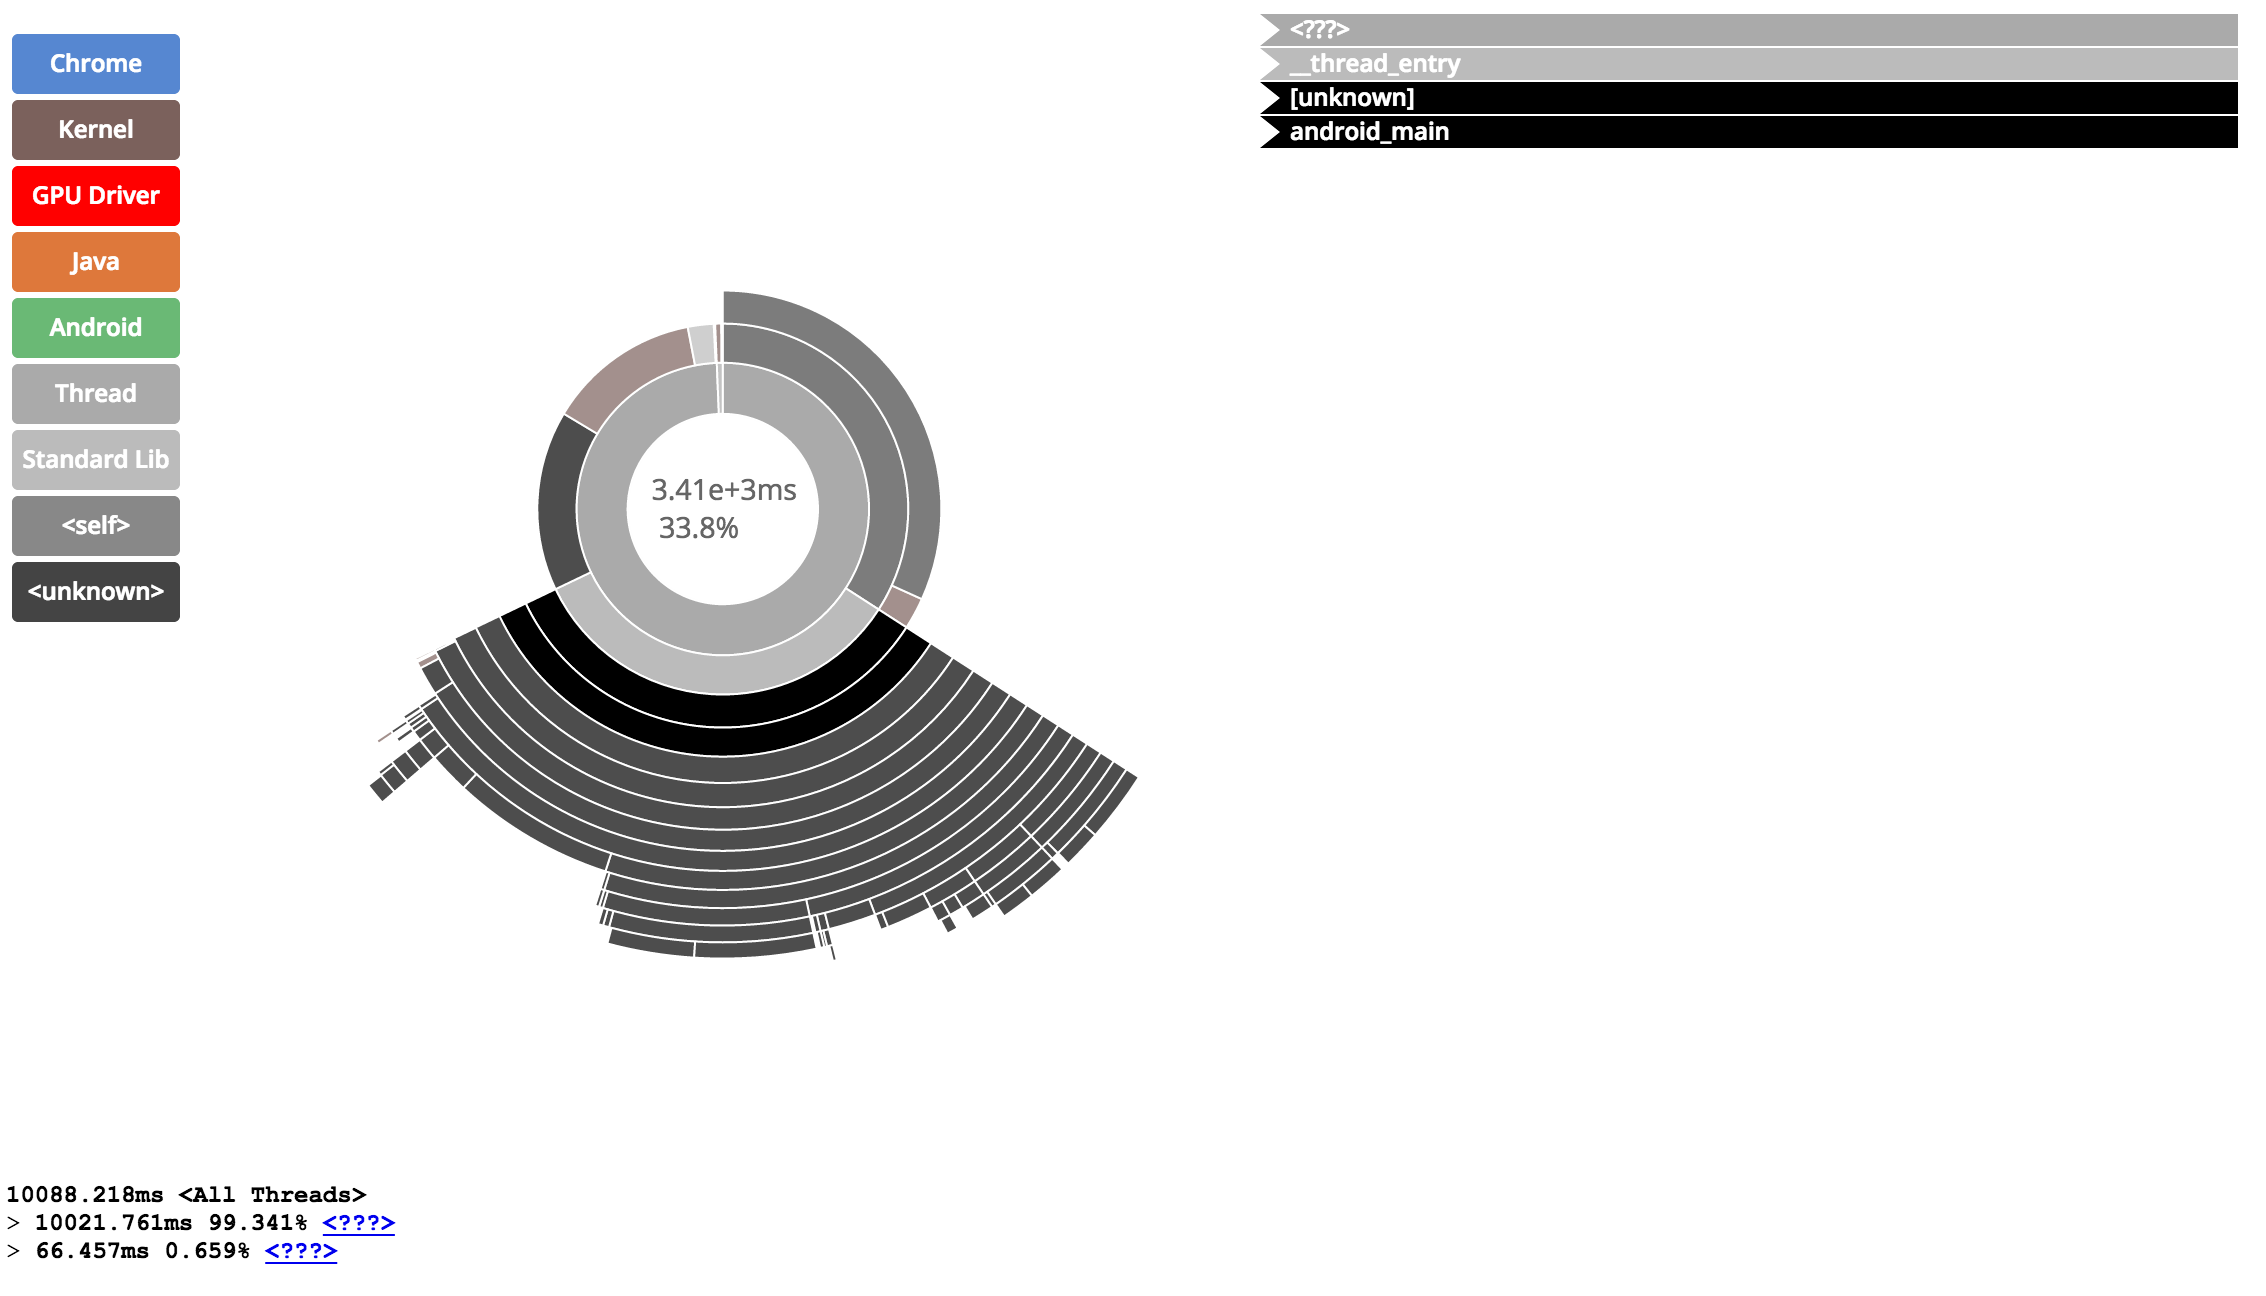
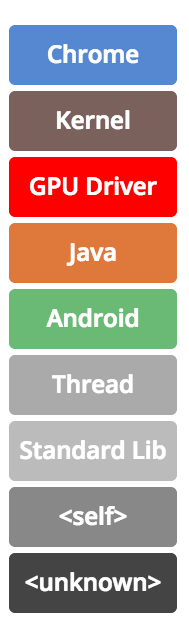
The multi-colored box on the left is a legend that very roughly classifies a subset of objects profiled:
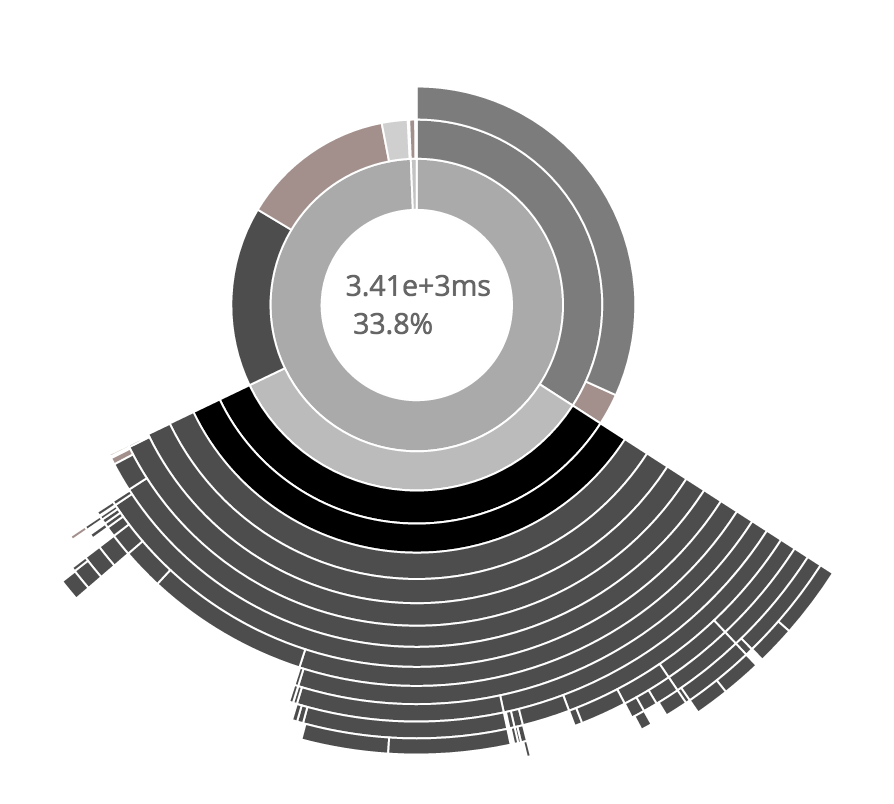
The center of the report is populated by a chart which contains concentric rings where each ring represents a level of the stack from the entry point of the application at the center out to the leaf functions on the outside of the chart. The top number in the center of the chart describes the total time used by the function highlighted by the mouse pointer on the chart. The lower number provides the percentage of the time the function was called for over the profiling period.
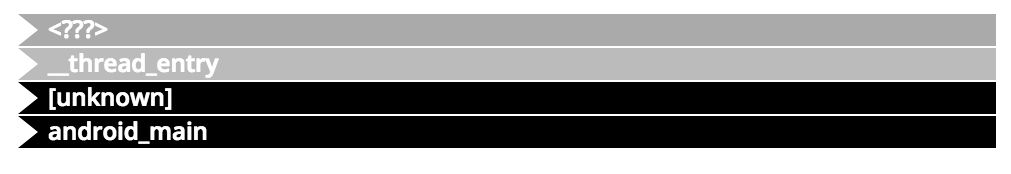
When a ring is highlighted in the chart, the stack trace of visible functions in the chart are shown on the top right side of the screen:
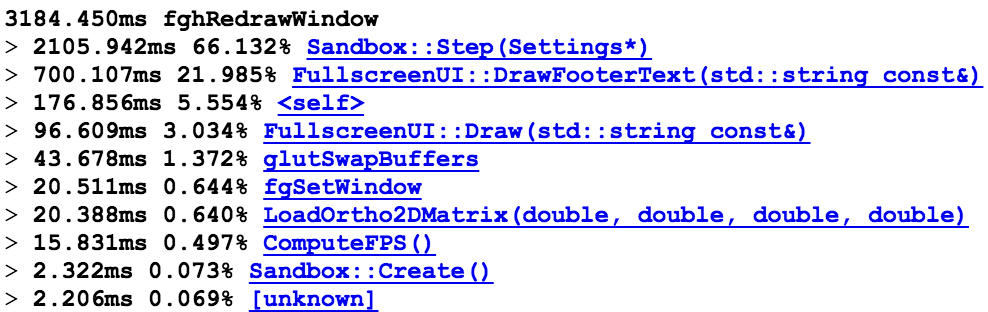
Finally, the stack for the currently selected function is shown along with the percent of time spent in each function on the bottom left of the screen:
An example report generated from a profile of LiquidFun's Testbed application, captured on a Nexus 5, is available to browse here.
Linux Perf provides the report command to view a perf.data trace file. This command can be invoked via android_ndk_perf using the following:
report provides a view similar to the visualize command's output with a tree view showing a call graph hierarchy and the percentage of time spent in each function down the graph.
A more terse overview of the data can be retrieved using:
Which will produce something like the following, summarizing the amount of time spent in each function over the profiling period:

