Litmus Proxy: Capture and Analyze Your LLM Interactions
The Litmus Proxy provides a powerful and transparent way to log and understand interactions with your Large Language Models (LLMs), including Vertex AI and other providers. By routing your LLM API traffic through the proxy, you gain valuable insights into usage patterns, performance, and potential areas for improvement.
Benefits:
- Centralized Logging: Capture all LLM API requests and responses in a unified log, simplifying monitoring and analysis.
- Enhanced Debugging: Easily troubleshoot issues and identify the root cause of unexpected behavior with detailed logs of LLM interactions.
- Usage Analysis: Gain insights into how your LLMs are being utilized, enabling you to optimize prompts, identify common queries, and track performance over time.
- Customizable Integrations: Forward logs to various destinations like Cloud Logging or your preferred monitoring tools for further analysis and visualization.
Getting Started
Prerequisites
- Google Cloud Project with the following APIs enabled:
- Cloud Run API
- Secret Manager API
- Google Cloud SDK installed and configured
Deployment
Install the Litmus CLI:
- Linux:
- install:
curl https://storage.googleapis.com/litmus-cloud/install/linux.sh | sudo sh - binary: https://storage.googleapis.com/litmus-cloud/prod/linux/litmus
- sha256: https://storage.googleapis.com/litmus-cloud/prod/linux/litmus.sha256
- install:
- OSX:
- install:
curl https://storage.googleapis.com/litmus-cloud/install/osx.sh | sudo sh - binary: https://storage.googleapis.com/litmus-cloud/prod/osx/litmus
- sha256: https://storage.googleapis.com/litmus-cloud/prod/osx/litmus.sha256
- install:
- Linux:
Deploy the Proxy:
- Select a desired upstream URL from the available list by running:
bashlitmus proxy deploy- Alternatively, deploy with a specific upstream URL:
bashlitmus proxy deploy --upstreamURL <your_upstream_url>- Replace
<your_upstream_url>with the desired upstream endpoint (e.g.,europe-west1-aiplatform.googleapis.com).
Usage
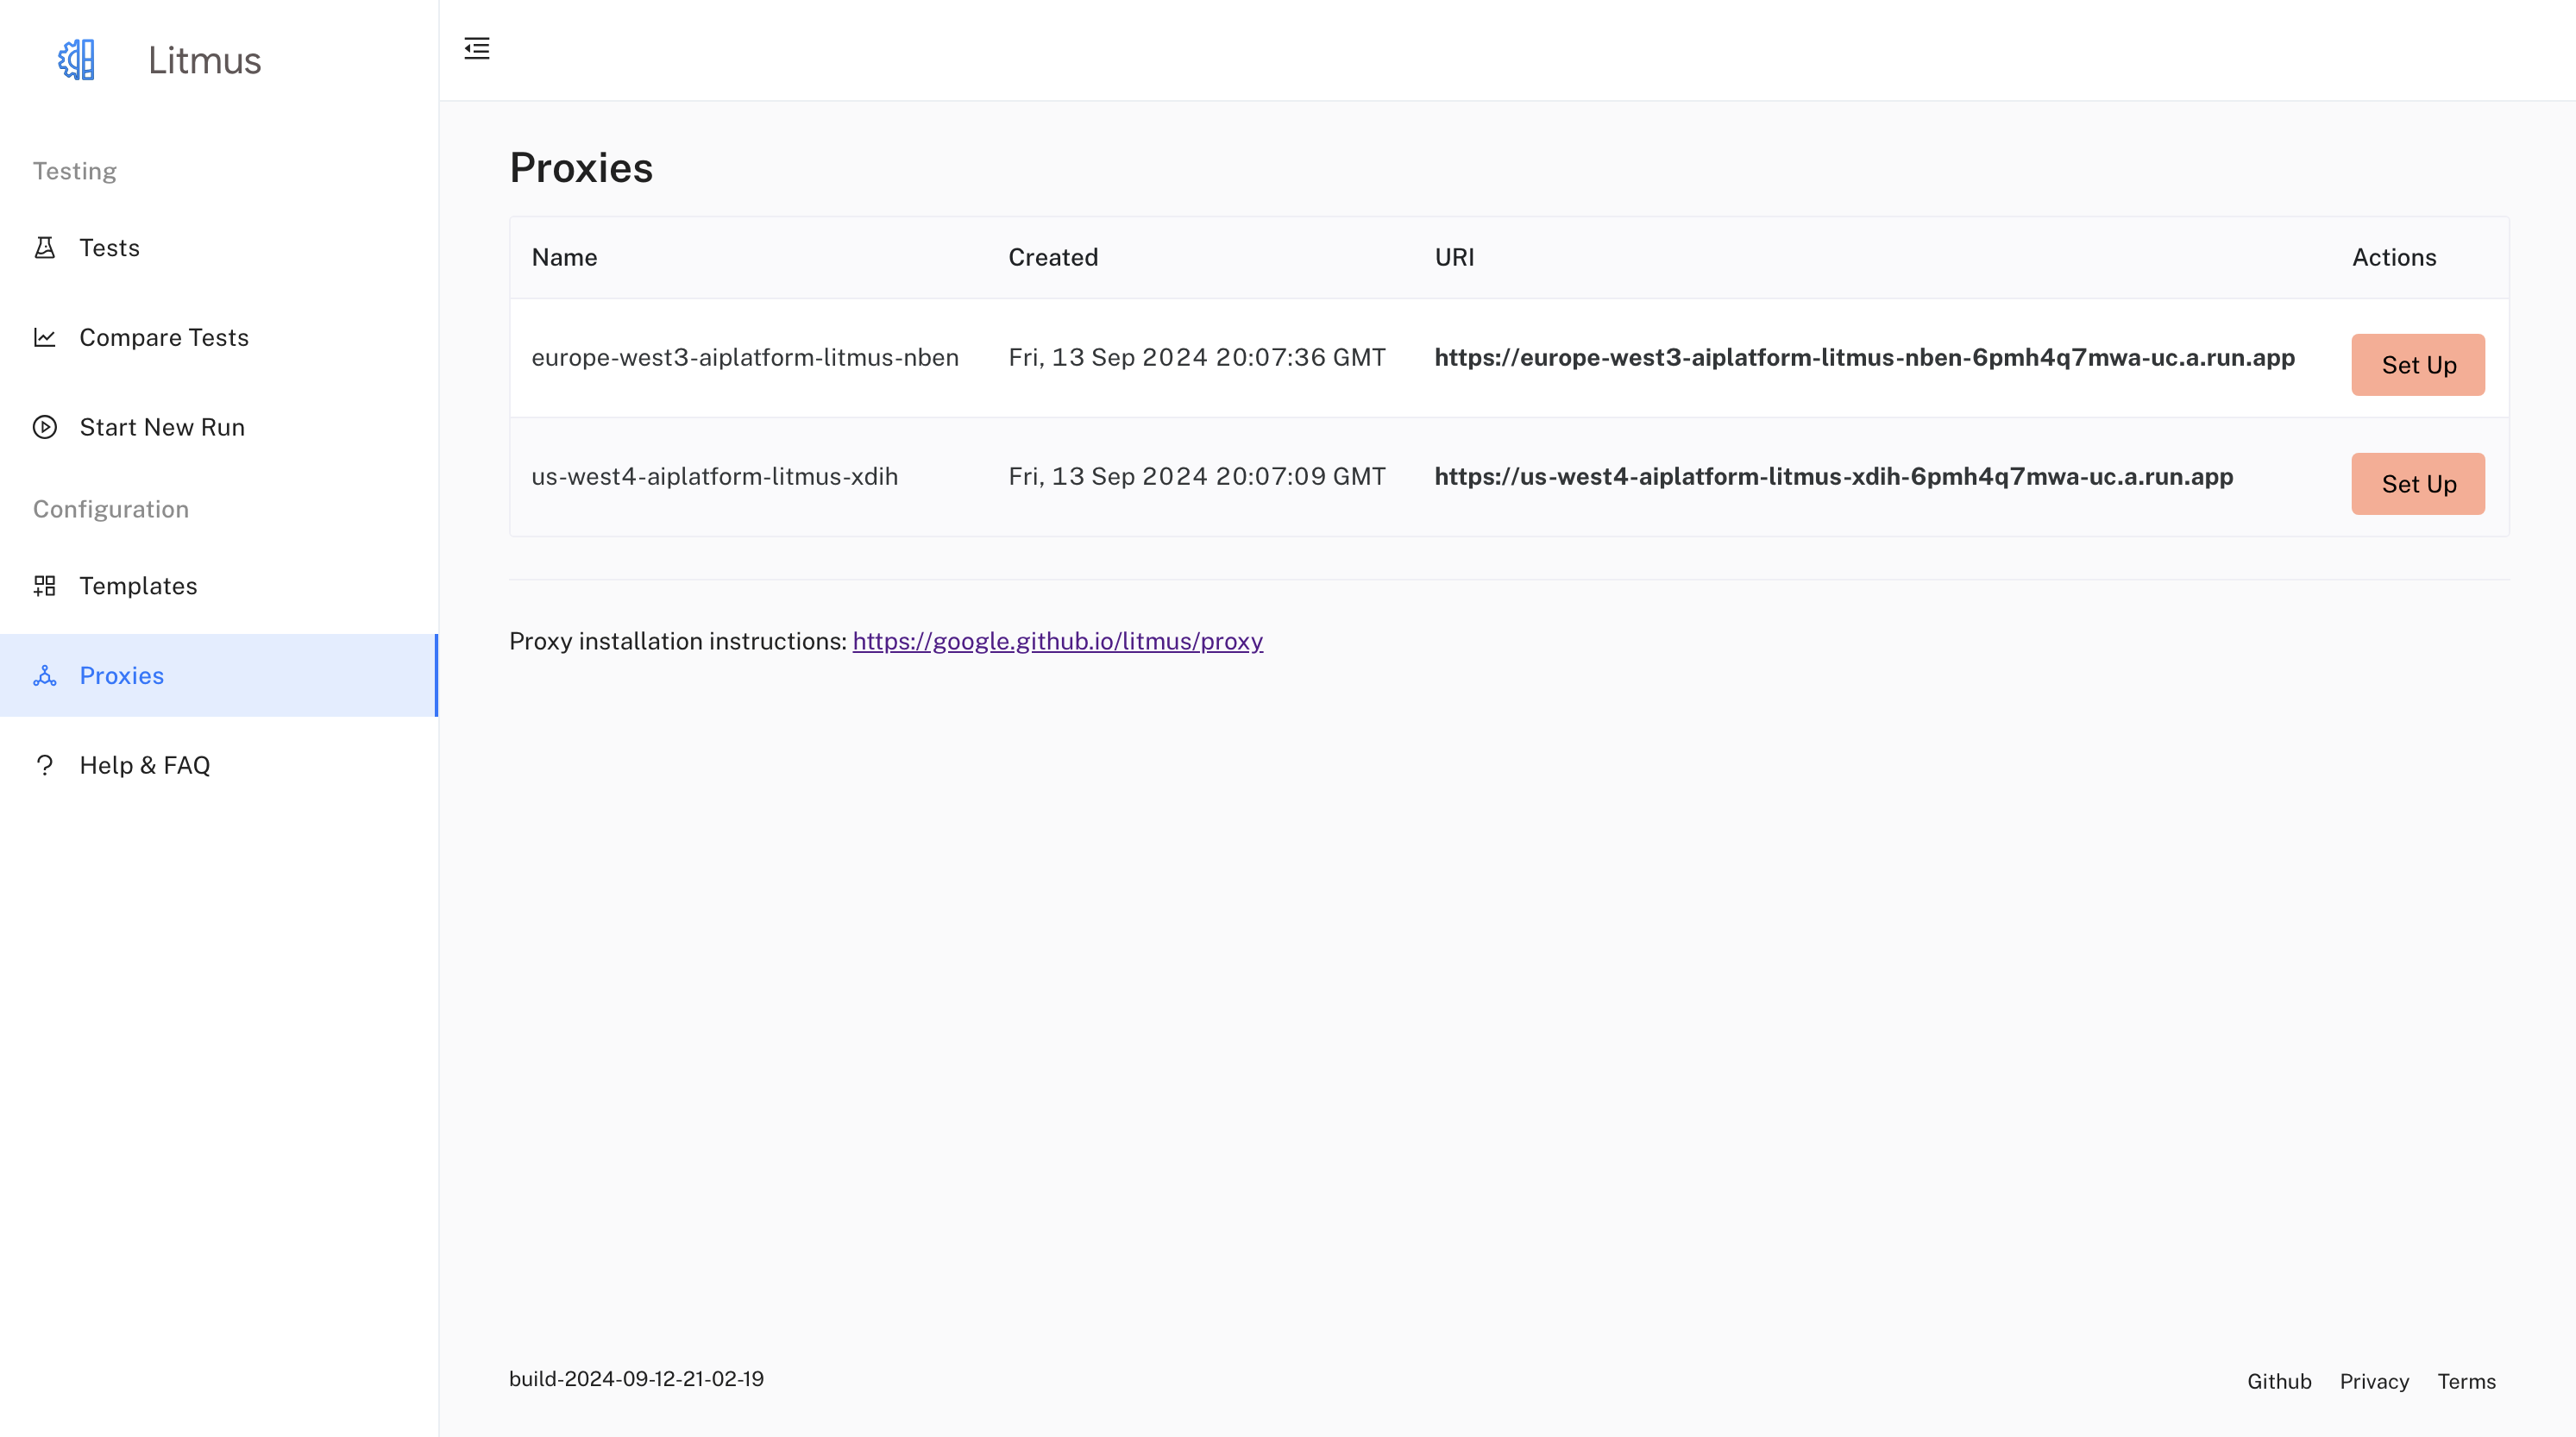
Retrieve Proxy Endpoint:
Obtain the URL of your deployed proxy service by running:
bashlitmus proxy listThis command will display the names of your deployed proxy service.
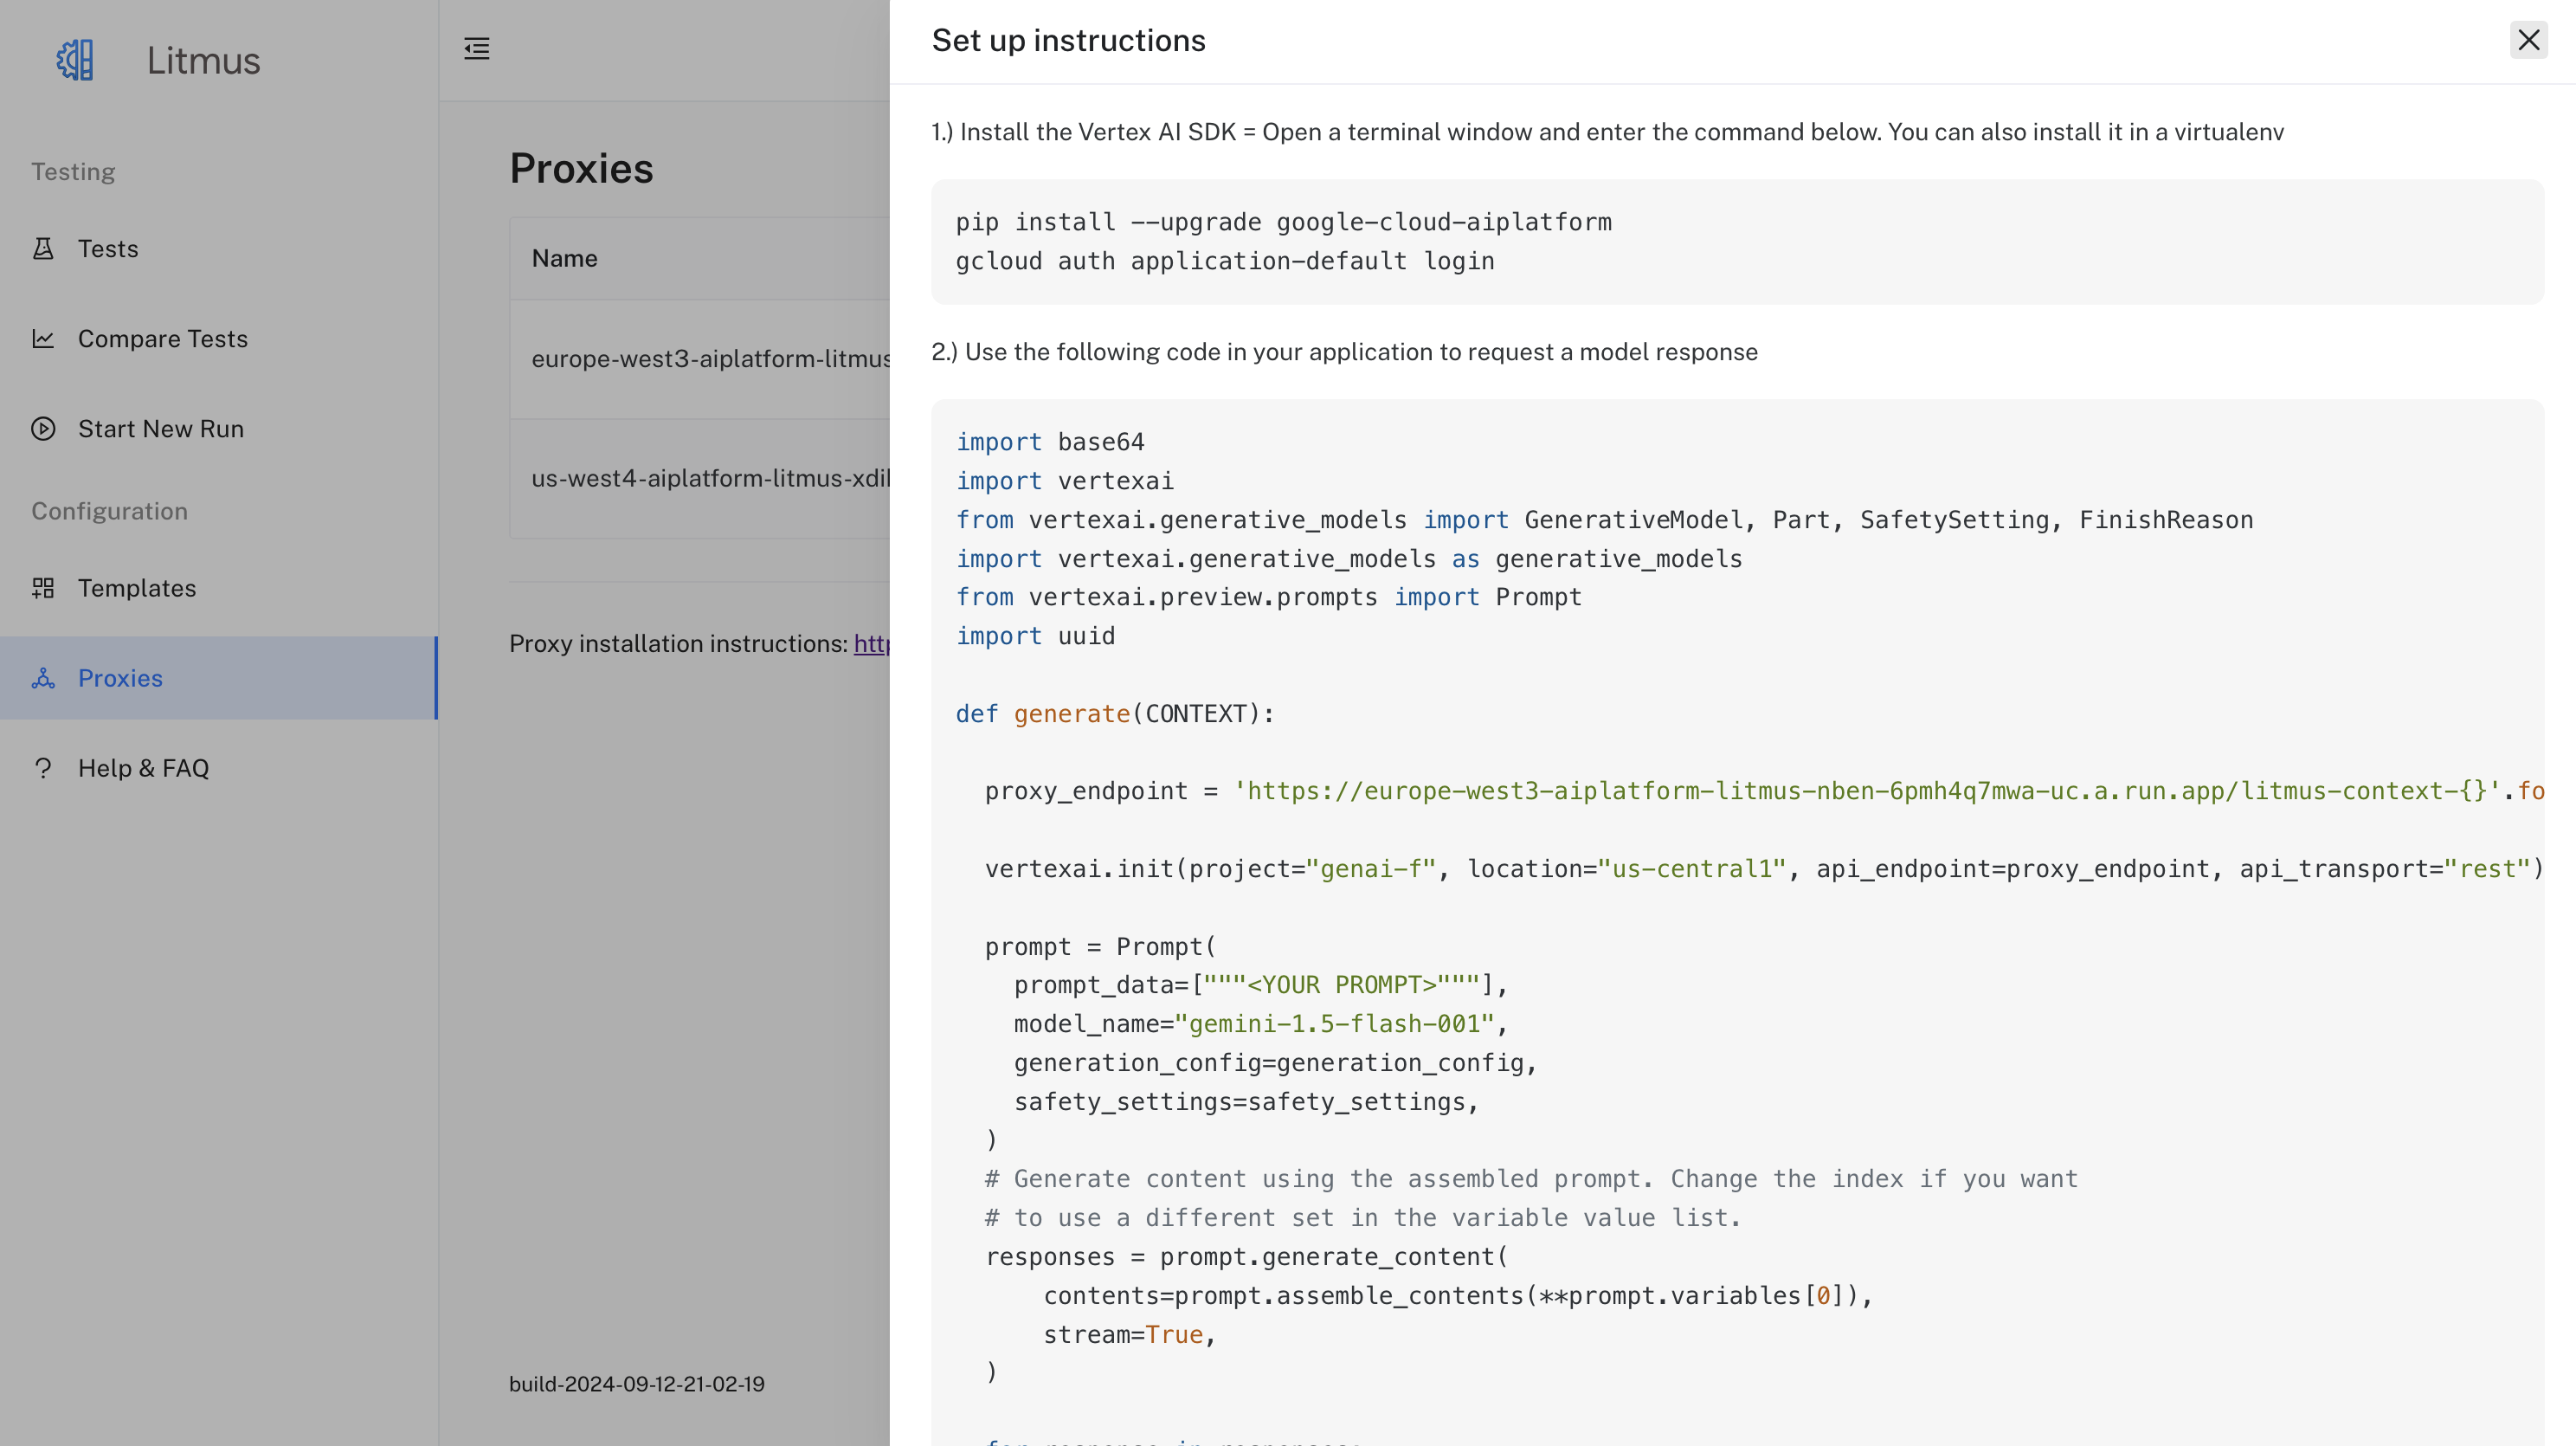
Configure your LLM Client (Python SDK):
Update your Vertex AI client initialization to utilize the proxy endpoint:
Before:
pythonimport vertexai vertexai.init(project=project, location=location)After:
pythonimport vertexai proxy_endpoint = 'YOUR_PROXY_ENDPOINT' # Replace with the actual endpoint from step 1. vertexai.init(project=project, location=location, api_endpoint=proxy_endpoint, api_transport="rest")Optional: Adding Context
There is also the possibility to add a context which is inserted into the logs in the litmusContext field.
The context is set by adding "/litmus-context-{YOUR CONTEXT ID}" to the end of the proxy endpoint as such:
Context Example:
pythonimport vertexai proxy_endpoint = 'YOUR_PROXY_ENDPOINT/litmus-context-{YOUR CONTEXT ID}' vertexai.init(project=project, location=location, api_endpoint=proxy_endpoint, api_transport="rest")
Quick Setup in the UI
Additional Commands
Remove Proxy Service:
bashlitmus proxy destroy <service_name>Remove All Proxy Services:
bashlitmus proxy destroy-all
Log Analysis
The Litmus Proxy logs provide a detailed record of each LLM interaction, including:
- Timestamp
- Request method (e.g., POST)
- Request URI
- Upstream LLM endpoint
- Request headers
- Request body (including prompts and parameters)
- Response status code
- Response body (including LLM outputs)
- Latency
You can leverage these logs to:
- Monitor LLM health and performance.
- Identify and debug issues with LLM responses.
- Analyze usage patterns and optimize prompts.
We encourage you to contribute your ideas and feedback to help us enhance the Litmus Proxy.