Test Run Analysis
This page outlines how to use the Litmus user interface (UI) to analyze test runs.
Prerequisites
- You have submitted a test run using the Litmus UI.
- You are logged into the Litmus UI.
Steps
Navigate to the 'Tests' Page: From the main Litmus UI dashboard, click on the "Tests" link in the sidebar navigation.
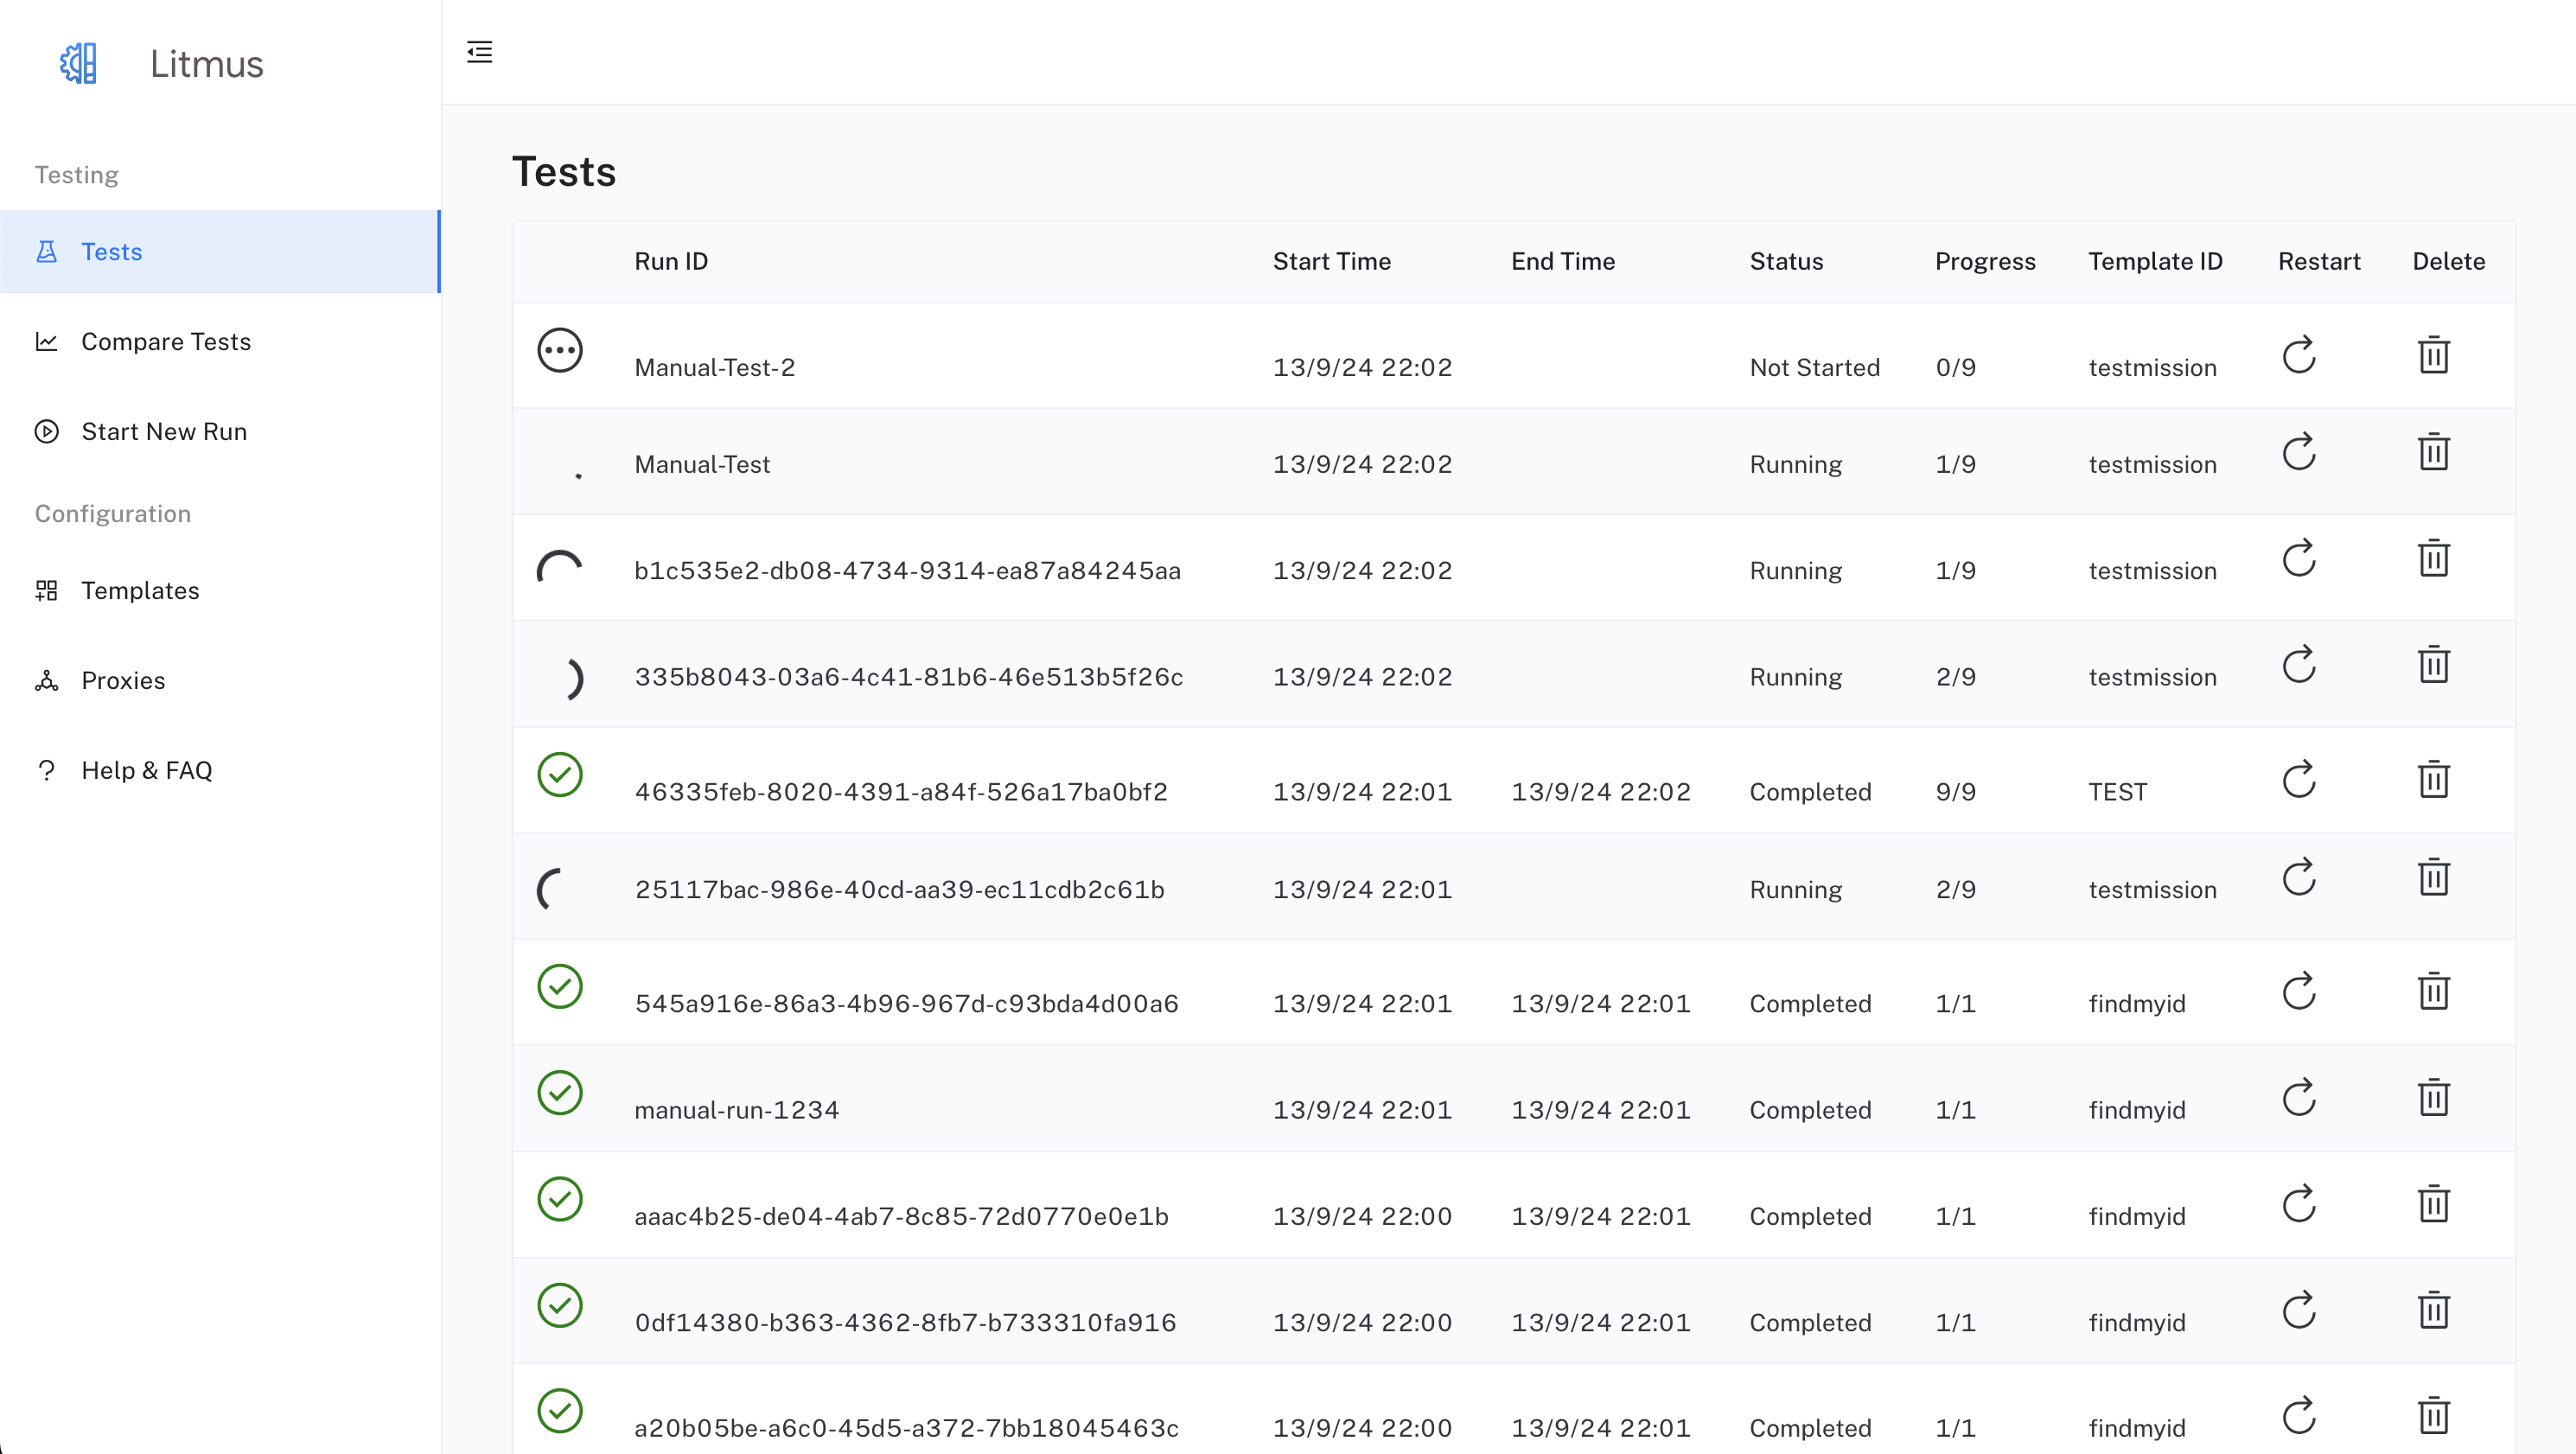
Locate Your Test Run: The 'Tests' page displays a table listing all submitted test runs. Find the run you want to analyze, identifiable by its unique
Run ID,Template ID, and timestamp.View Run Details: Clicking on any cell in the row for your test run will navigate you to the detailed results page for that run. This page provides a comprehensive view of the run's status, progress, and test case information.
Analyze Test Case Results: The detailed results page presents a table with each row representing a test case from your run.
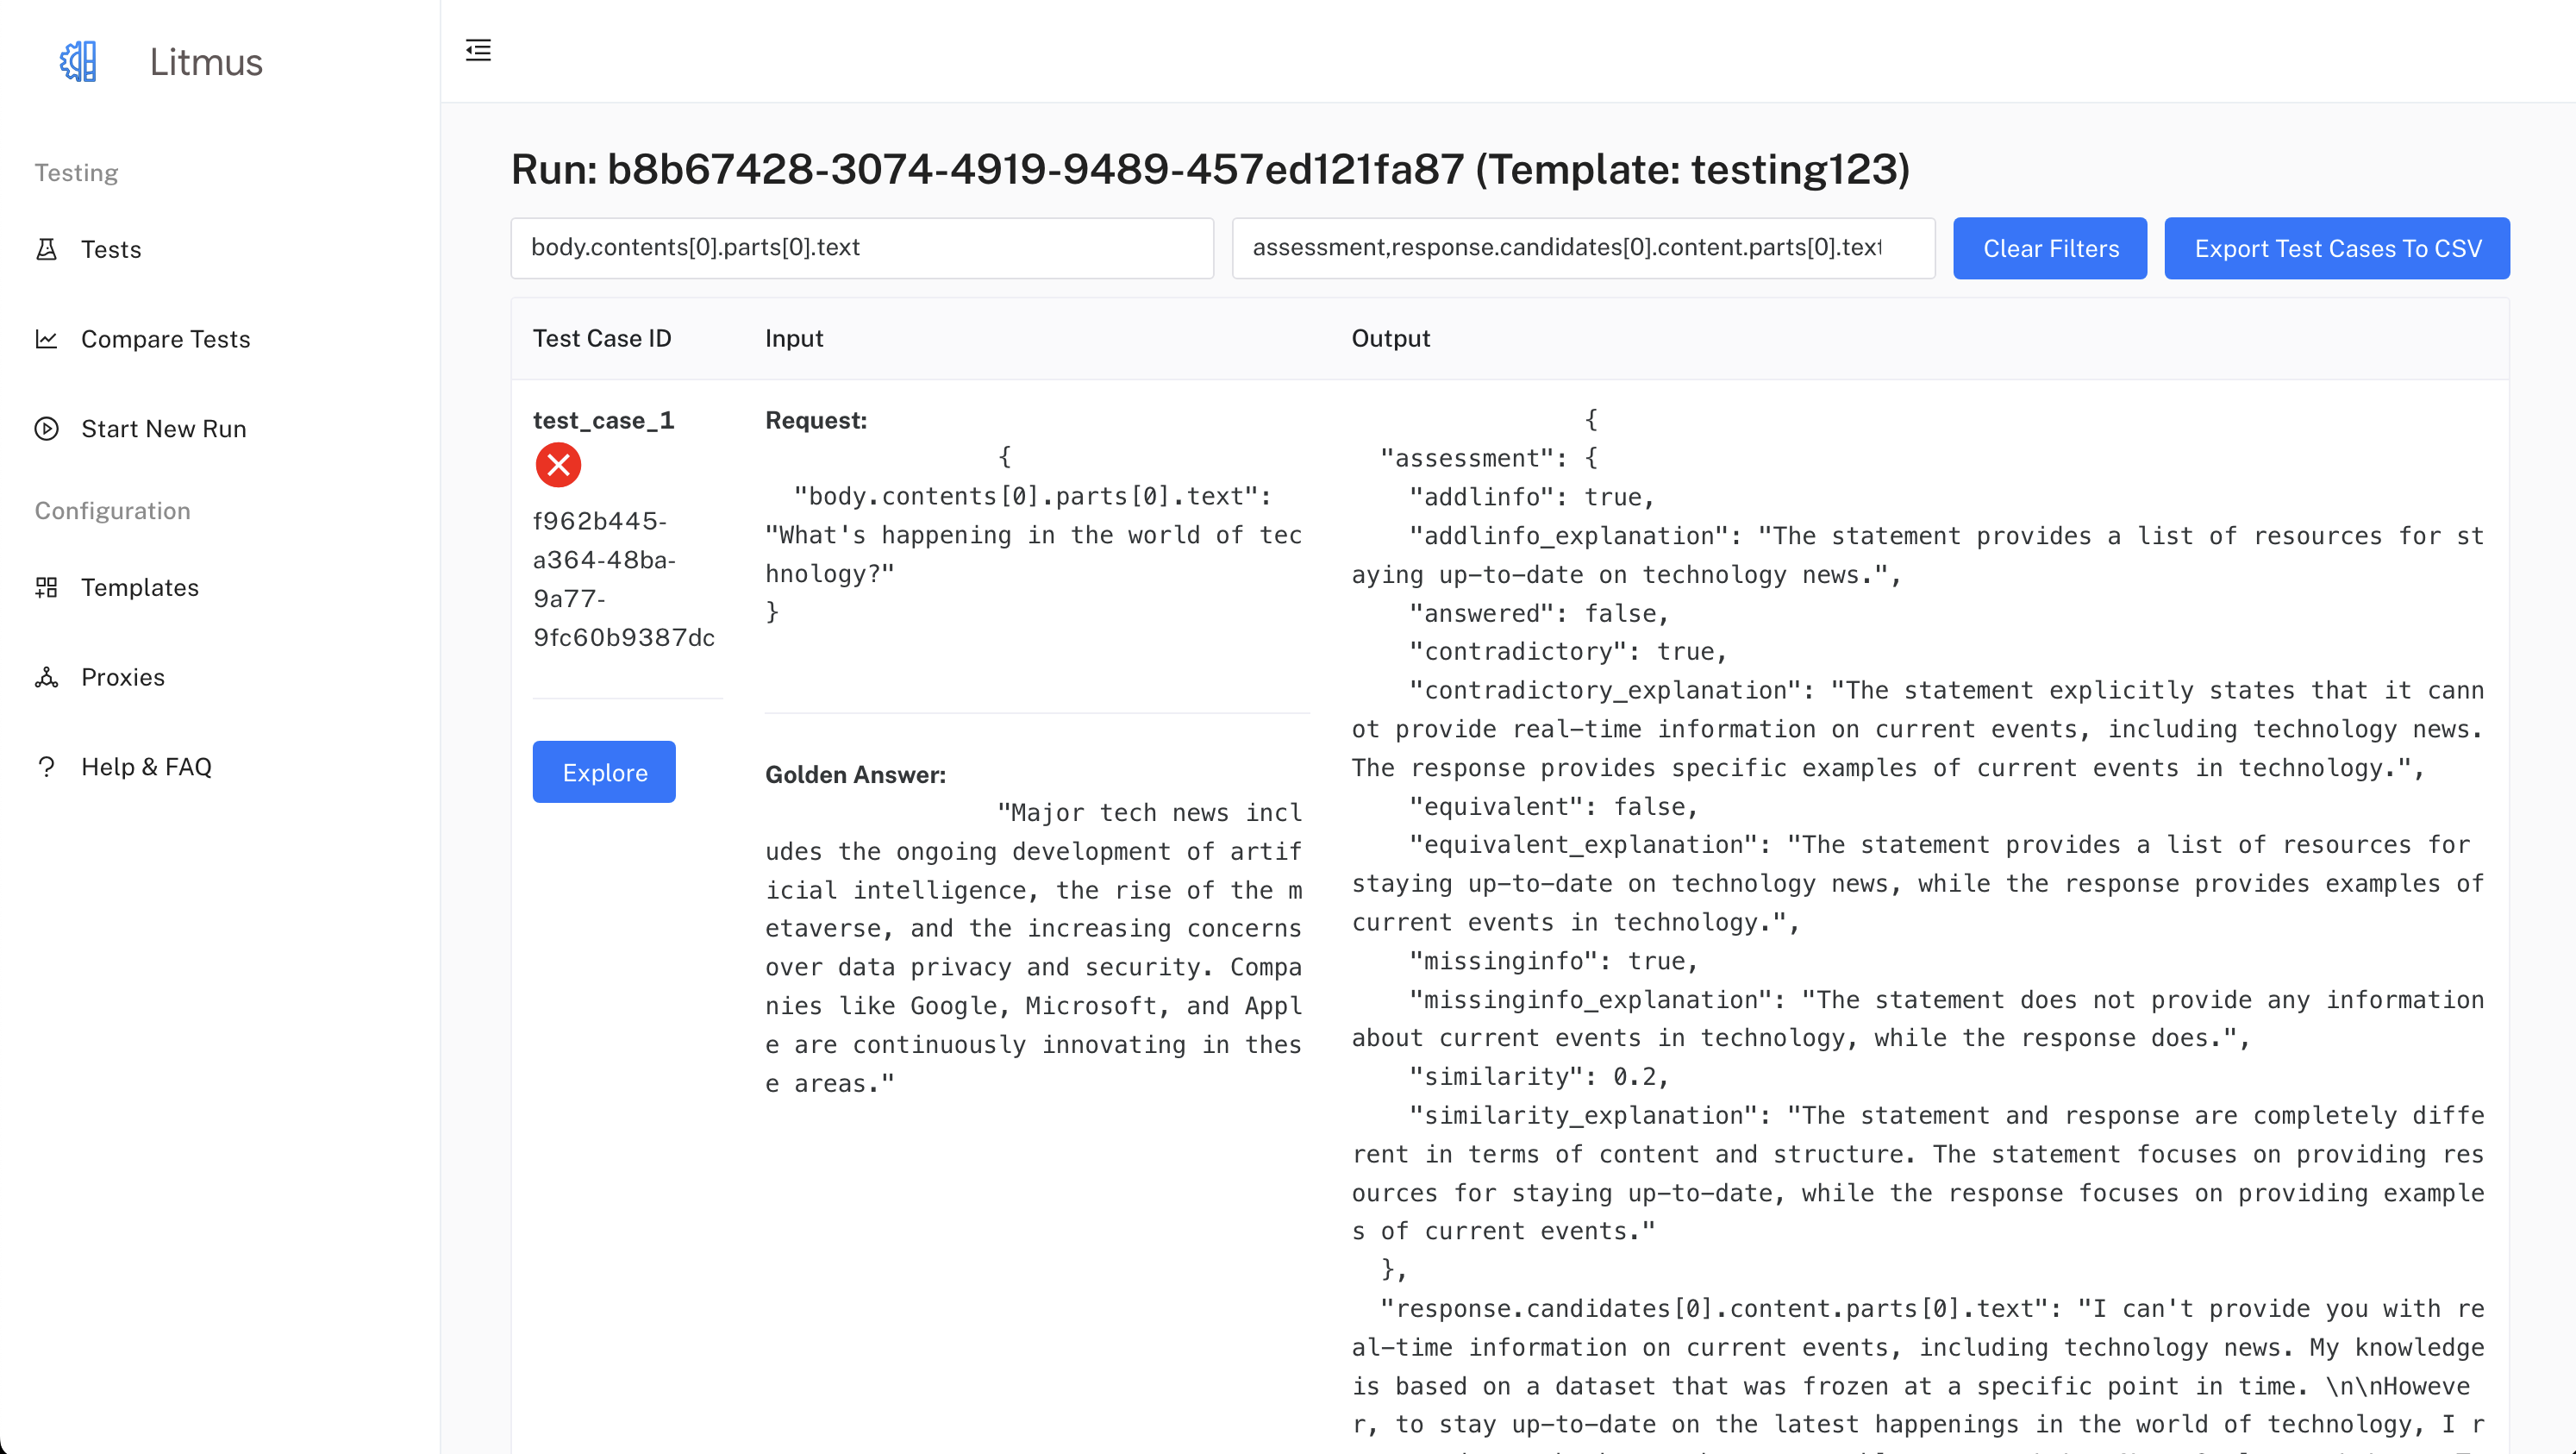
Each test case row displays:
- Test Case ID: A unique identifier for the test case.
- Input: The request and golden response data for the test case.
- Output: The actual response received from the AI model, including any LLM assessment.
Filter Results (Optional): You can refine the displayed results by using the filter inputs:
- Request Filter: Enter a specific key from the request payload to focus on test cases containing that key. For instance, entering "body.query" would filter for test cases where the "query" field within the request body matches the subsequent value you provide.
- Response Filter: Enter a specific key from the response payload to filter results based on response values. For example, entering "assessment.similarity" would display only test cases where the similarity score, as determined by the LLM assessment, is available. You can separate multiple keys with commas to filter on multiple values, such as "response.output.text,assessment,status."
- Clear Filters Button: Removes any applied filters and displays all test cases for the run.
Explore Individual Traces: Each test case row includes an "Explore" button. Clicking this button opens a drawer providing deeper insights into the specific test case execution:
- Tracing ID: The drawer's title displays the unique tracing ID associated with this test case, allowing you to correlate the test case execution with proxy logs.
- Proxy Log Data: The drawer displays proxy log data for the selected tracing ID, pulled from BigQuery. This data includes details about the request (headers, body) sent to the AI model, the response received, and performance metrics like latency.
- Field Selection: You can choose specific fields to display from the proxy log data by selecting checkboxes. This allows you to focus on particular aspects of the request and response. Important fields, such as text, timestamp, and token counts are selected by default.
- Data Export: Two export buttons are available:
- Export Table to CSV: Downloads a CSV file containing the data currently displayed in the table (filtered by selected fields).
- Export all Data to JSON File: Downloads a JSON file containing all the proxy log data for the selected tracing ID, regardless of the selected fields.
Additional Notes
- The availability of proxy log data depends on whether the proxy service is enabled and configured correctly.
- For runs with a large number of test cases, the initial loading of results might take some time.
- The UI is designed to provide an intuitive way to explore test run results and troubleshoot model behavior.
- Familiarize yourself with the structure of your request and response payloads to utilize the filter and data exploration features effectively.