Comparing Test Runs
The Litmus UI provides a feature to compare the results of multiple test runs using the same template, allowing you to analyze and understand the differences in responses and LLM assessments over time or across different model configurations.
Steps
Access the Compare Tests View:
- Navigate to the Compare Tests page from the sidebar. This will display a table of all available templates.
Select a Template:
- Click the Compare Tests button next to the template you want to compare runs for. This will take you to the Template Results page.
Apply Filters (Optional):
- On the Template Results page, you can use the filter inputs to refine the data displayed in the table.
- Request Filter: Enter a JSON path (e.g.,
body.query) to filter the test cases based on the content of the request payload. Only runs that include test cases matching the specified request filter will be displayed. - Response Filter: Enter one or more comma-separated JSON paths (e.g.,
assessment.similarity,response.output.text) to filter the displayed results for each run. Only the values at the specified paths will be shown in the table.
- Request Filter: Enter a JSON path (e.g.,
- On the Template Results page, you can use the filter inputs to refine the data displayed in the table.
View the Comparison Table:
- The table displays the filtered results for all runs that match the selected template and applied filters.
- Each row in the table represents a unique value from the specified
Request Filter. - The corresponding column for each run displays the
Response Filterdata for all test cases that match theRequest Filtervalue. - This allows you to easily compare how different runs responded to the same request, focusing on specific aspects defined by the response filter.
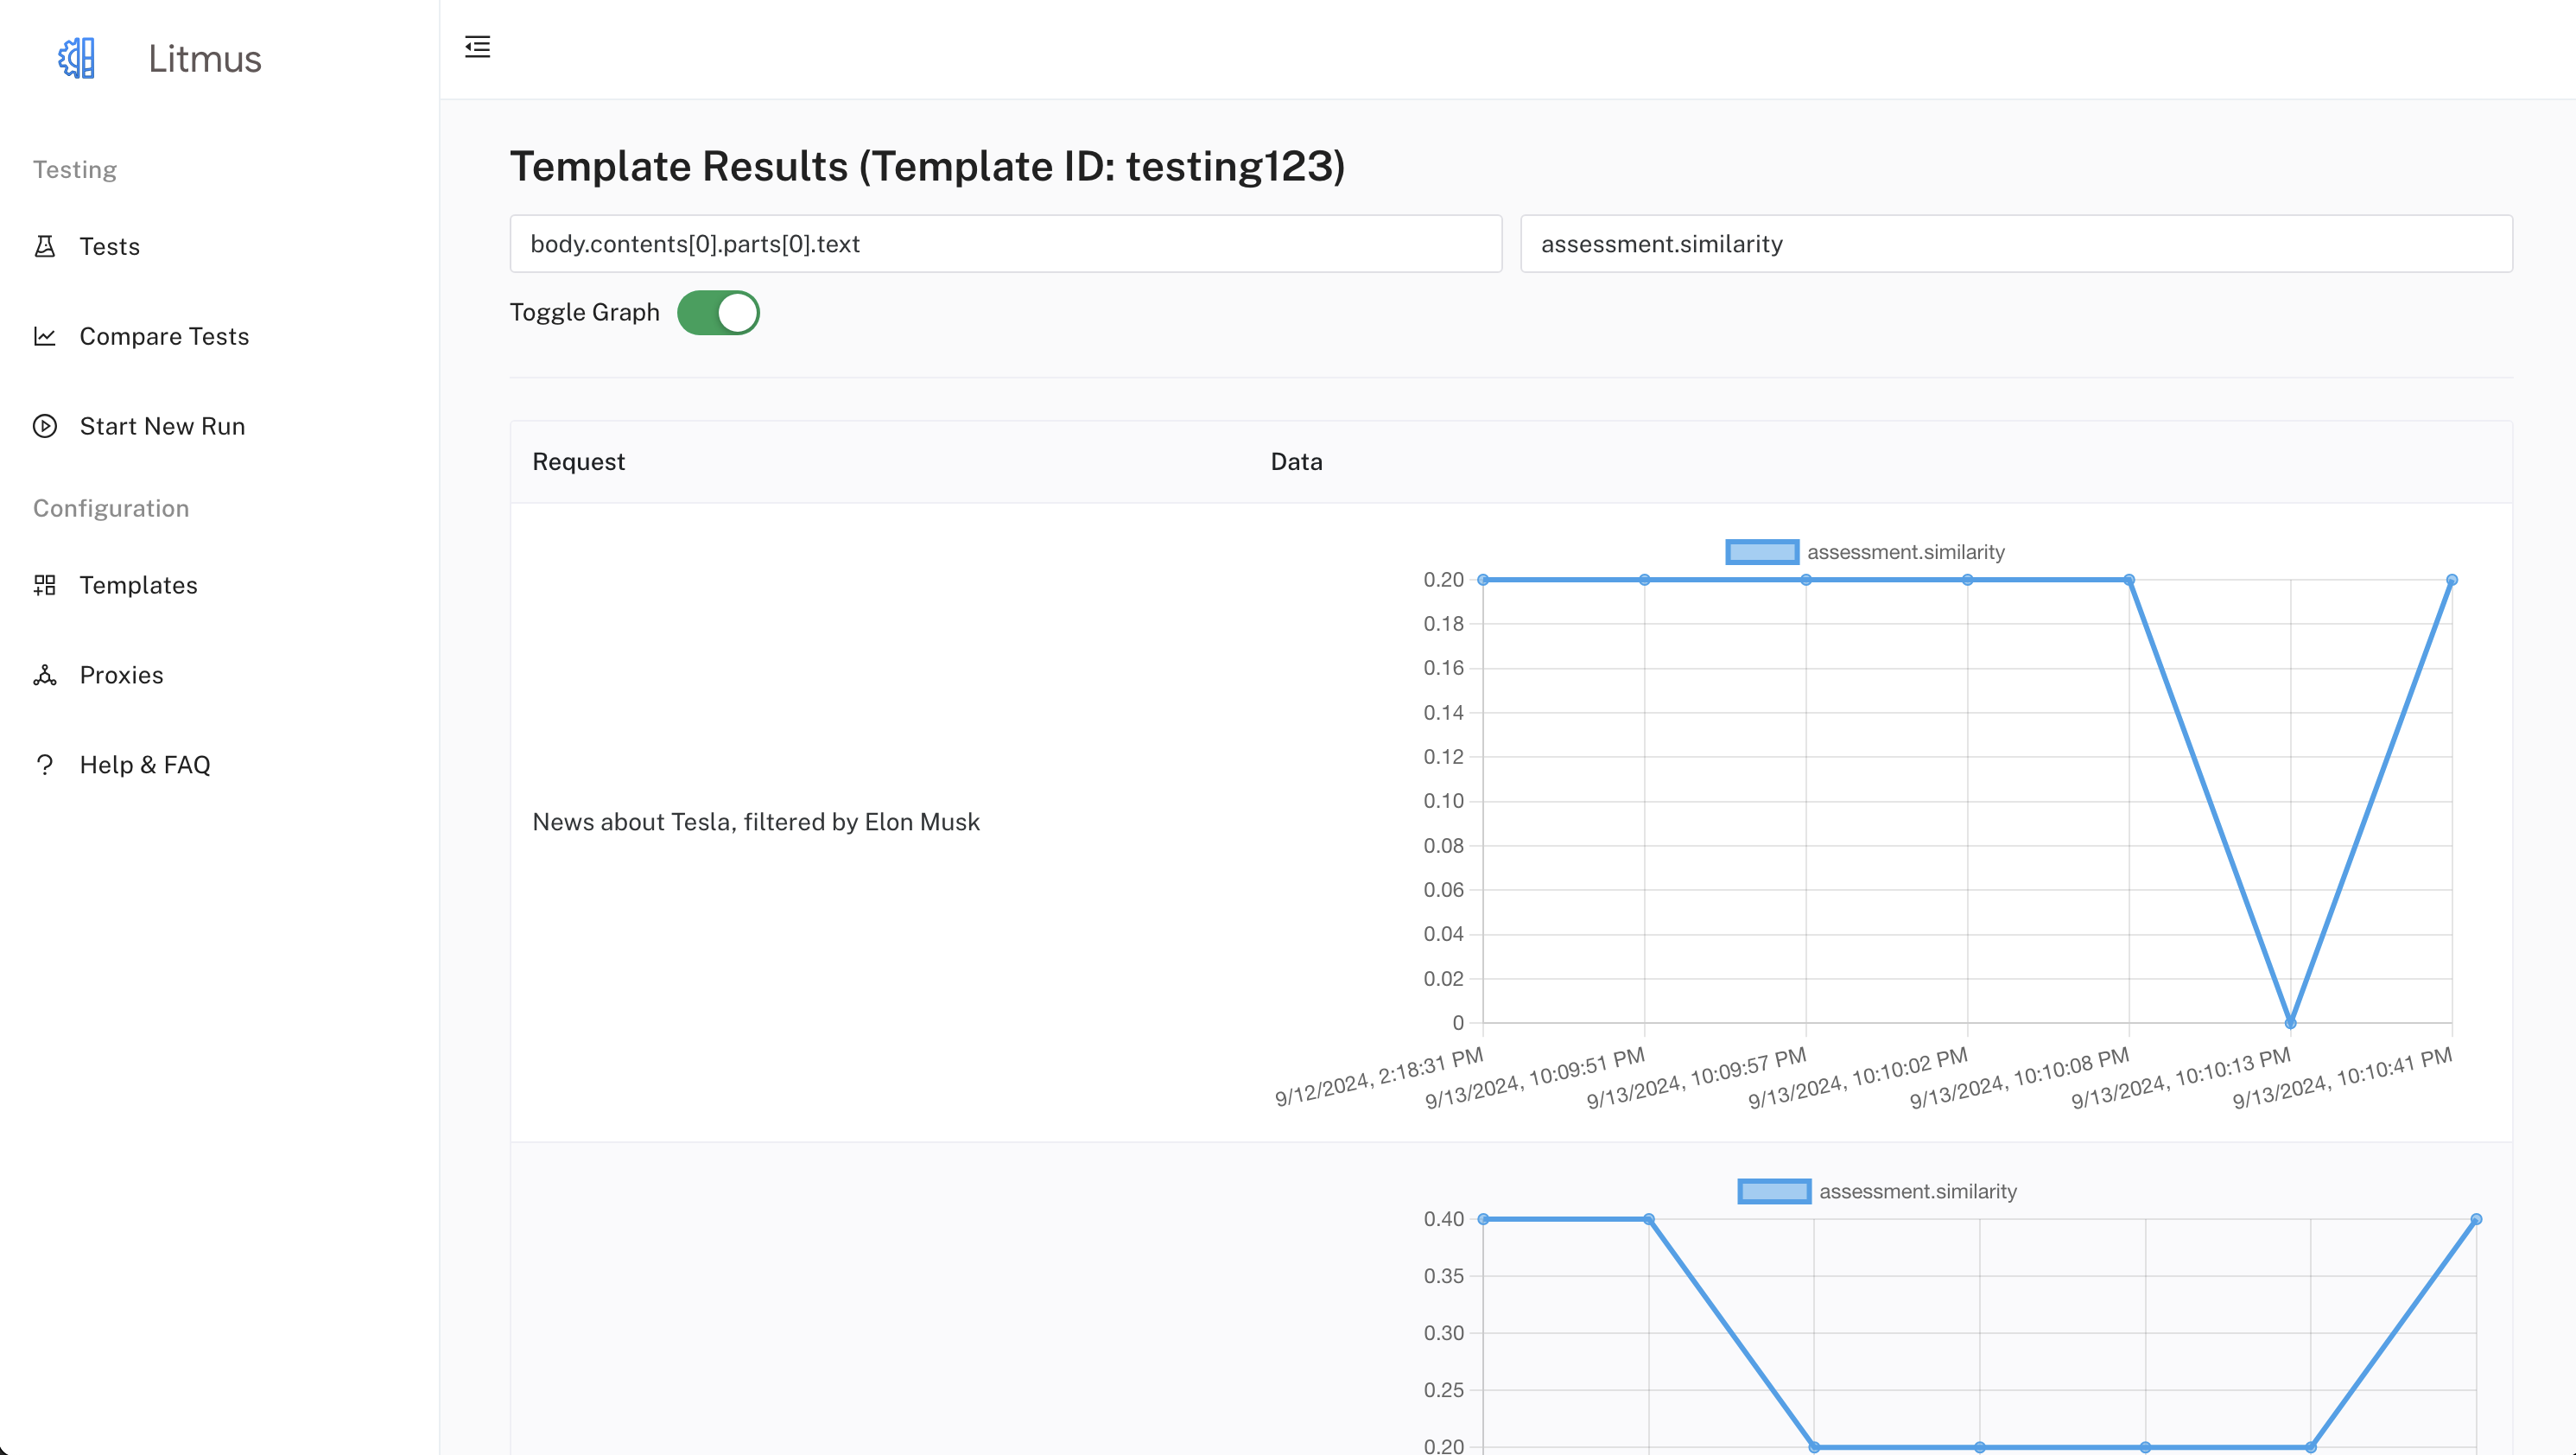
Toggle Chart View (Optional):
- Enable the Show Charts toggle switch to visualize the comparison data as line charts.
- Charts provide a visual representation of how the selected response value (e.g.,
assessment.similarity) changed over time for each unique request value. - This can help you identify trends, anomalies, and differences in model performance across runs.
Example
Let's say you have a template with an input field body.query and you want to compare the similarity scores (assessment.similarity) generated by the LLM for different queries across multiple test runs.
- Request Filter:
body.query - Response Filter:
assessment.similarity
The comparison table will show each unique query from your test cases as a row. For each run, you'll see the corresponding similarity score that was assigned to that query.
By enabling the chart view, you can visualize how the similarity scores for each query changed across the different runs, making it easier to spot patterns and variations.
Additional Notes
- The comparison feature is most effective when comparing runs that use the same template and have similar test case structures.
- Filtering the data appropriately can help you focus on the most relevant aspects of the comparison.
- Charts are helpful for visualizing trends and changes in response values over time.