Start a New Test Run
This guide will walk you through starting a new test run using the Litmus UI.
Prerequisites:
- You have deployed the Litmus application.
- You have access to the Litmus UI in your browser.
- You have created at least one Test Template.
Steps:
Navigate to the "Start New Run" page:
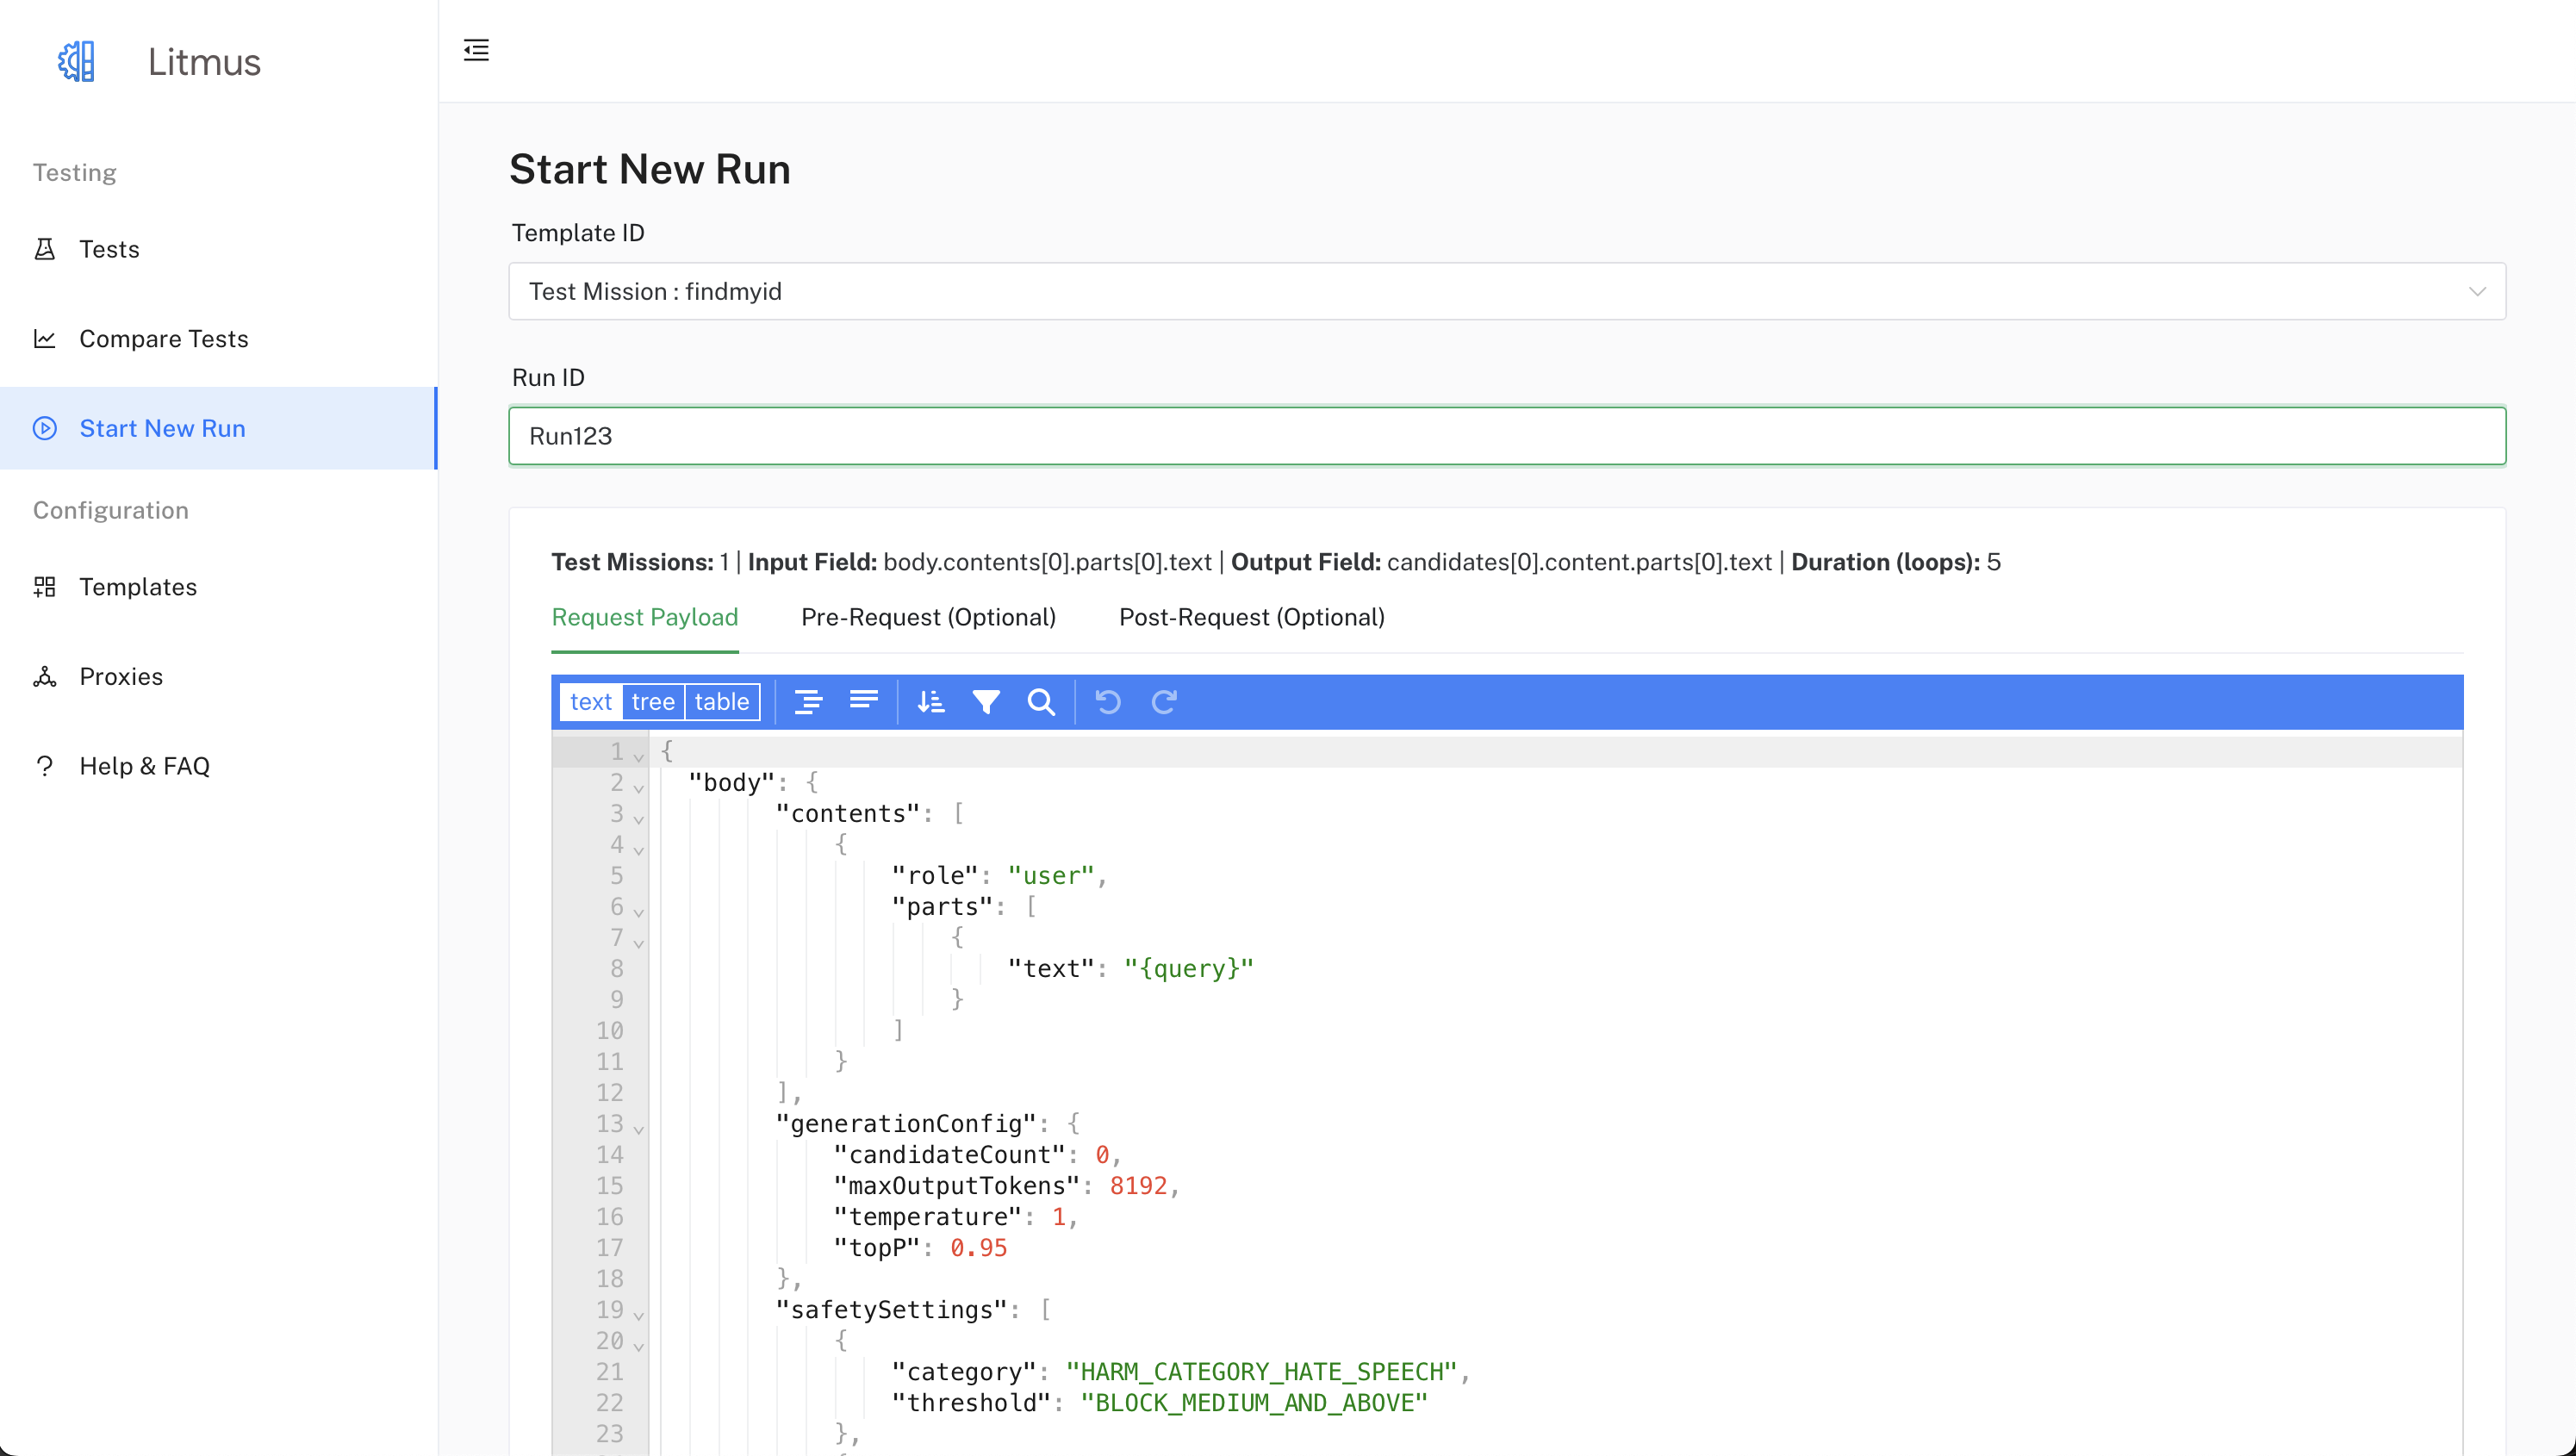
- From the Litmus UI, click on the "Start New Run" item in the left sidebar.
Select a Test Template:
- Choose the desired template from the "Template ID" dropdown. This will display available templates of both types: "Test Run" and "Test Mission".
- The available test cases, input, and output fields for the chosen template will be shown.
- When selecting a "Test Mission" template, you'll see the mission duration defined in the template.
Enter a Run ID:
- Input a unique identifier for this specific test run in the "Run ID" field.
- This ID will help you distinguish this run from others.
(Optional) Modify Request Payload:
- Review the default request payload displayed in the "Request Payload" tab.
- You can modify this payload if needed, using the available tokens: {query}, {response}, {filter}, {source}, {block}, {category}. For "Test Missions", the {query} token will be replaced by the LLM's generated requests in each interaction loop.
- Ensure the payload is valid JSON.
(Optional) Configure Pre-Request and Post-Request:
- If required, you can define a pre-request to be executed before each test case in the "Pre-Request" tab.
- Similarly, you can define a post-request to be executed after each test case in the "Post-Request" tab.
- These requests are optional and allow you to set up and tear down your testing environment.
(Optional) Test Your Request:
- Before submitting your test run, click the "Test Request" button within the "Request Payload" tab.
- This sends a single request using the defined payload and allows you to verify it's correctly formatted and reaches your endpoint.
- If successful, you can then select the "Output" tab to view the response structure.
Submit the Test Run:
- After reviewing all configurations, click the "Submit Run" button.
- This initiates the test run using the chosen template and your configurations.
- If you chose a "Test Mission" template, the LLM will be invoked to guide the interactions for the specified duration.
Monitor Run Progress:
- You can track the progress of your run on the "Tests" page, accessible from the sidebar.
- The page displays the run ID, start time, status, and progress. For "Test Missions", the progress shows the current turn in the mission.
- When the run completes, its status will change from "Running" to "Completed"
View Results:
- Click on a completed run ID to view its detailed results.
- For "Test Runs", this page displays each test case and its outcome: success or failure, along with assessment results.
- For "Test Missions", you'll see the full conversation history, the final assessment, and details about each interaction loop.
- You can further explore individual requests, responses, and assessment results (if applicable) by clicking the "Explore" button.
Note:
- Ensure that the request payload and pre/post requests (if defined) are valid JSON structures.
- If using the "Test Request" function, remember to select the output field for viewing the response structure.
- You can use filter options to narrow down the displayed test cases on the run results page.
That's it! You've successfully started a new test run.