Data Explorer
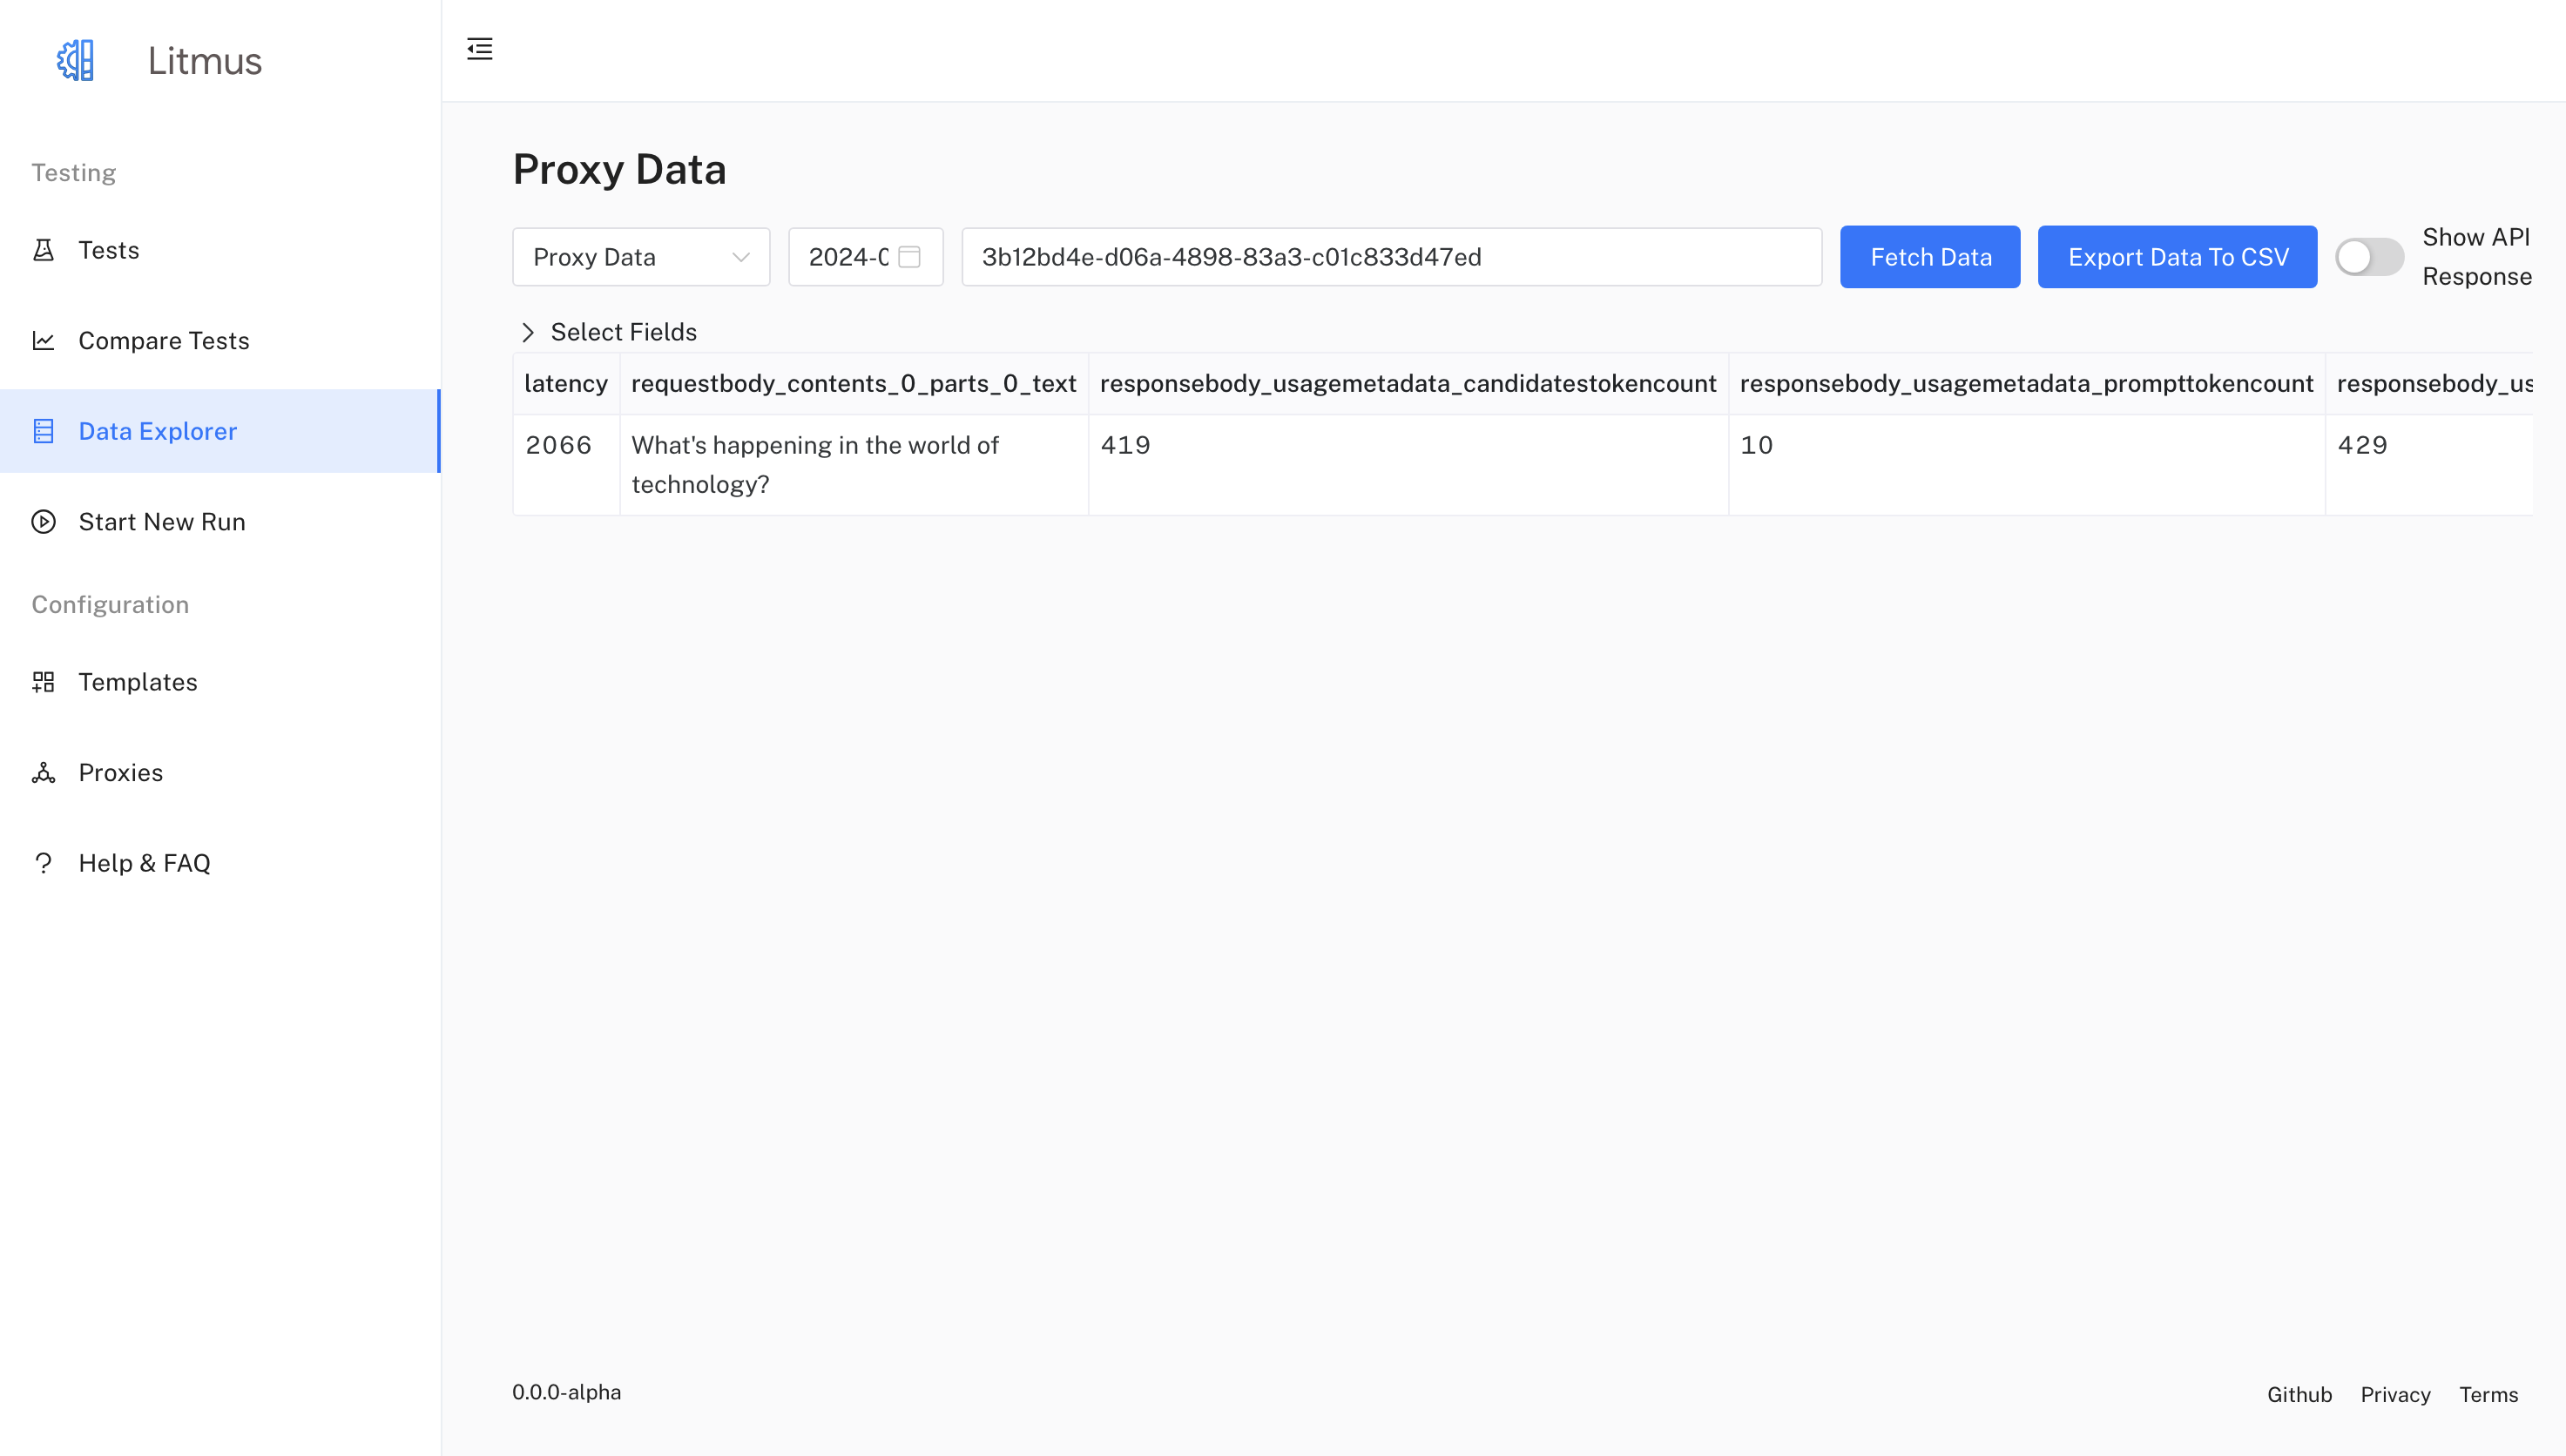
The Data Explorer in Litmus gives you a way to delve deeper into the logs generated by the Litmus proxy and the Litmus Worker, providing a more comprehensive view of your API interactions over time. This allows you to analyze the raw logs and uncover insights that might not be immediately apparent in the standard test run results.

Exploring Raw Proxy Logs
- Access the Data Explorer:
- Navigate to the Data Explorer page in the sidebar.
- Select a Date:
- Choose a date for which proxy logs are available. Litmus pulls these logs from BigQuery for the specified date.
- (Optional) Filter by Context:
- Use the Context Filter input to narrow down the logs to a specific context.
- Select Fields:
- Expand the Select Fields section to choose the specific fields you'd like to view from the proxy logs.
- Litmus displays important fields like
response.text,timestamp, andtotaltokencountby default.
- View the Data Table:
- The table presents the selected fields from the logs, allowing you to examine the details of each LLM interaction.
Using the Data Explorer
The Data Explorer provides flexibility in exploring proxy data, allowing you to:
- Understand LLM Usage Patterns:
- Identify the most common requests and analyze how your LLMs are being utilized.
- Monitor Performance:
- Track latency, token usage, and other metrics over time to assess LLM performance.
- Debug Issues:
- Examine request and response details to pinpoint the root cause of unexpected behavior or errors.
- Optimize Prompts:
- Analyze how different prompt structures and parameters affect LLM outputs and token consumption.
Features
- Filtering:
- Narrow down data by context and date.
- Select specific fields for focused analysis.
- Sorting:
- Sort the table by any column for easier exploration.
- Exporting:
- Export the current table view to a CSV file.
Example Use Cases
- Tracking Token Usage:
- By viewing the
totaltokencountfield, you can monitor your LLM's token consumption over time. This helps you understand usage patterns and potentially optimize your prompts to reduce token costs.
- By viewing the
- Analyzing Latency:
- The
latencyfield provides insights into the response times of your LLMs. You can identify slow responses and investigate potential performance bottlenecks.
- The
- Debugging Model Errors:
- If a test case fails, you can use the Data Explorer to examine the full request and response details, including headers and body content, to understand why the model didn't respond as expected.
Tips
- Utilize filtering and sorting: These features help you focus on specific aspects of the data and make it easier to find relevant information.
- Combine with test run results: Correlate data from the Data Explorer with your test run analysis for a more comprehensive understanding of your LLM's behavior.
- Regularly review proxy logs: Periodically reviewing proxy data can reveal trends and potential issues before they become significant problems.
The Data Explorer, in conjunction with other features of Litmus, empowers you to gain deep insights into your LLM interactions, enabling you to build and deploy more robust and efficient GenAI applications.
